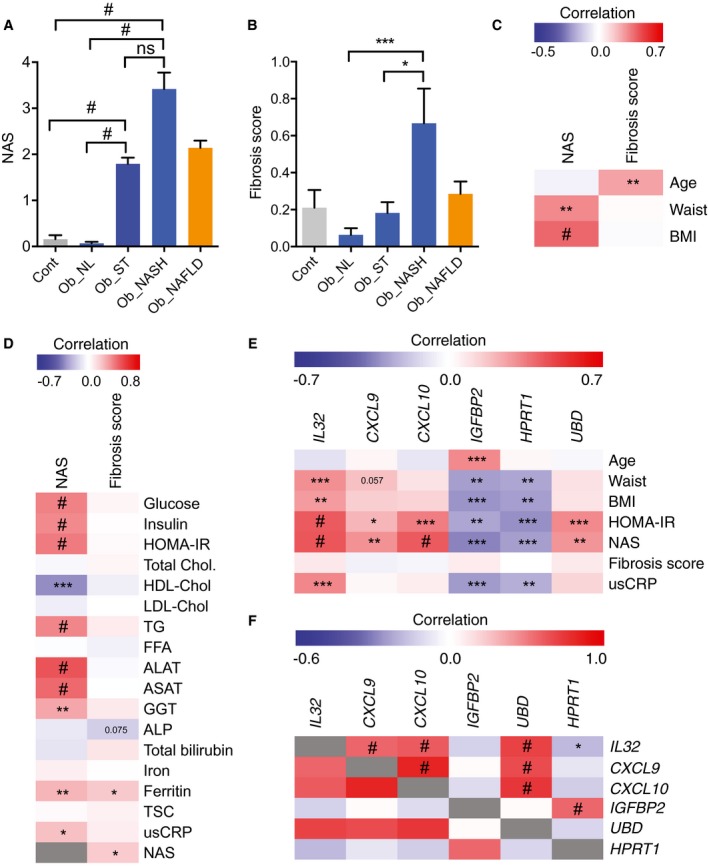
Figure 4.

NAFLD activity score, fibrosis score and correlation with biochemical parameters and NAFLD molecular signature. (A) NAS variation in control patients without obesity who received a cholecystectomy and in patients who received bariatric surgery in Ob_NL, Ob_ST, Ob_NASH, and Ob_NAFLD (Ob_ST + Ob_NASH) groups. (B) Fibrosis score variation in Ob_NL, Ob_ST, Ob_NASH, and Ob_NAFLD compared to controls. (C) Heatmap of the Spearman correlation of NAS and fibrosis score relative to age, waist circumference, and BMI in our cohort of patients. (D) Heatmap of the Spearman correlation of NAS and fibrosis score relative to biochemical parameters in our cohort of patients. (E) Heatmap of the Spearman correlation of the DE genes IL32, CXCL9, CXCL10, IGFBP2, HPRT1, and UBD in liver samples relative to age, waist circumference, BMI, HOMA‐IR index, NAS, fibrosis score, and usCRP in our cohort of patients. (F) Heatmap of gene‐to‐gene correlation analysis of the qRT‐PCR profile for the most intercorrelated genes found by microarray analysis. IL32 correlated positively and significantly with CXCL9, CXCL10, and UBD and correlated negatively with HPRT1. The down‐regulated genes IGFBP2 and HPRT1 were strongly and positively intercorrelated. The intensities of the red and blue color reflect the degree of positive and negative correlation, respectively. The gray color is the correlation of each parameter to itself (r = 1). Results are expressed as mean ± SEM; #P < 0.0001, ***P < 0.001, **P < 0.01, *P < 0.05. Abbreviations: FFA, free fatty acid; TG, triglyceride; TSC, transferrin saturation capacity.
