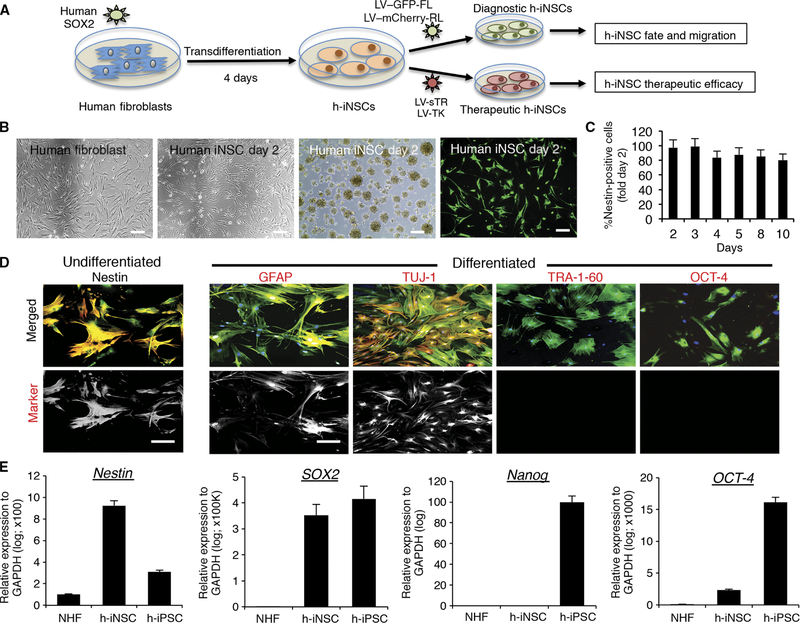
Fig. 1. Generation and characterization of diagnostic and therapeutic h-iNSCTE.
(A) Schematic depiction of the strategy used to create therapeutic and diagnostic variants of h-iNSCTE. Human fibroblasts were transduced with SOX2 and placed in NSC-inducing medium. After 4 days, the h-iNSCTE were expanded and transduced with optical reporters or tumoricidal transgenes. (B) White light and fluorescence photomicrographs of human fibroblasts and h-iNSCTE grown as monolayers and neurospheres or stained with antibodies against nestin (green). (C) Summary graph showing the expression of nestin over time at different days after induction of h-iNSCTE generation. (D) Immunofluorescence staining showing h-iNSCTE–GFP (green) expression of the NSC marker nestin (red) and GFAP+ astrocytes and TUJ-1+ neurons after differentiation by mitogen removal (staining shown in red). In contrast, no staining was observed for the pluripotency markers TRA-1–60 or OCT-4. Hoechst staining is shown in blue. Fluorescence images showing only the red (555 nm) secondary antibody channel are shown in the bottom row. (E) RT-PCR analysis of nestin, SOX2, nanog, and OCT-4 expression in NHF, h-iNSCTE, and h-iPSCs. Data in (C) and (E) are shown as means ± SEM (error bars are from three to four independent experiments; n = 3 technical replicates). Scale bars, 200 μm. GAPDH, glyceraldehyde-3-phosphate dehydrogenase.

