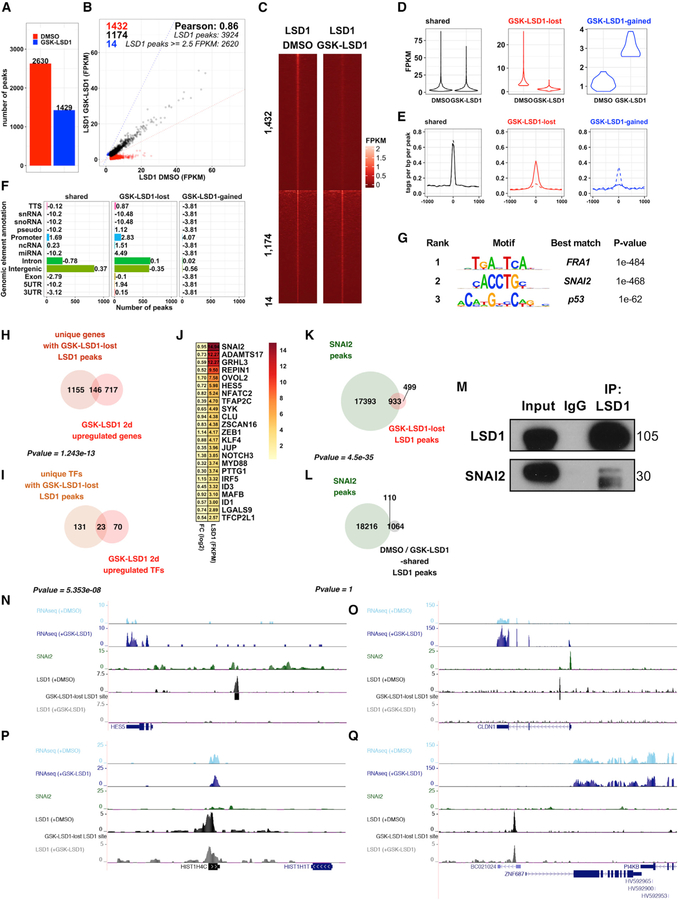
Figure 2. LSD1 Inhibition Prevents LSD1 Binding to Epidermal Differentiation Genes and SNAI2 Binding Sites.
(A) ChIP-seq demonstrates dramatic reduction in LSD1 peaks with LSD1 inhibition.
(B) Comparison of fragments per kilobase mapped (FPKM) normalized LSD1 binding intensities in DMSO- or GSK-LSD1-treated EPs.
(C and D) LSD1 binding intensities at shared, GSK-LSD1 lost, or GSK-LSD1-gained LSD1 sites (1 kb apart peak center) by heatmap (C) and violin plot (D).
(E) Average profiles of LSD1 binding at shared, GSK-LSD1 lost, and GSK-LSD1-gained sites. Solid lines represent LSD1 binding with DMSO, whereas dotted lines represent LSD1 binding with GSK-LSD1.
(F) Distribution of LSD1 binding sites at shared, GSK-LSD1 lost, and GSK-gained LSD1 sites (numbers = log2 enrichment).
(G) Top de novo motifs associated with GSK-LSD1 lost sites.
(H and I) Overlap between genes (H) and transcription factor-encoding genes (I) upregulated by GSK-LSD1 and associated with GSK-LSD1 lost LSD1 sites.
(J) Log2 fold changes (left) and LSD1 binding intensities (right) for GSK-LSD1 upregulated TFs with GSK-LSD1 lost LSD1 sites.
(K) Overlap of GSK-LSD1 lost LSD1 sites and SNAI2 binding sites (GSE55421) (Mistry et al., 2014).
(L) Overlap of LSD1 peaks common to DMSO- and GSK-LSD1-treated samples and SNAI2 peaks.
(M) LSD1 immunoprecipitation (IP) pulls down SNAI2 by coIP.
(N and O) LSD1 and SNAI2 shared target genes that lose LSD1 binding and increase in expression, HES5 (N) and CLDN1 (O).
(P and Q) LSD1 bound genes that do not lose LSD1 binding or increase in expression, HIST1H4C (P) and ZNF687 (Q), highlighting absence of SNAI2 binding.

