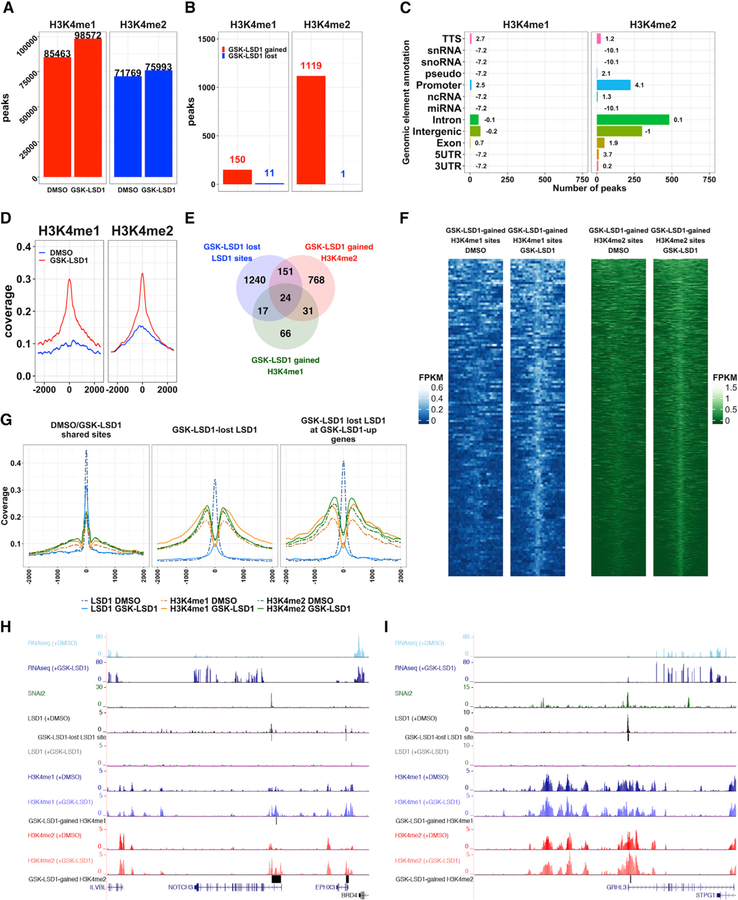
Figure 3. LSD1 Inhibition Drives Genome-wide Increases of H3K4me1 and H3K4me2 in Epidermal Progenitors.
(A) Number of H3K4me1/me2 peaks in DMSO- or GSK-LSD1-treated EPs in combined replicates (n = 2).
(B) Number of GSK-LSD1-gained or lost H3K4me1 and H3K4me2 regions.
(C) Distribution of GSK-LSD1-gained H3K4me1/me2 regions. Bolded numbers equal log2 enrichment.
(D) Average profile plots of H3K4me1 and H3K4me2 binding at GSK-LSD1-gained H3K4me1 or H3K4me2 regions in DMSO- (blue lines) or GSK-LSD1-treated EPs (red lines).
(E) Overlap between GSK-LSD1 lost LSD1 sites (1,432 peaks and 1,301 unique genes), GSK-LSD1-gained H3K4me1 regions (138 regions and 138 unique genes), and GSK-LSD1-gained H3K4me2 regions (974 regions and 941 unique genes).
(F) H3K4me1 and H3K4me2 binding occupancy at GSK-LSD1-gained H3K4me1 (left, blue) or H3K4me2 (right, green) regions in DMSO- or GSK-LSD1- treated EPs.
(G) Average profiles of LSD1, H3K4me1, and H3K4me2 binding at LSD1 peaks shared between DMSO- and GSK-LSD1-treated EPs (left panel), at GSK-LSD1 lost LSD1 peaks (center panel) and at GSK-LSD1 lost LSD1 peaks associated with GSK-LSD1 upregulated genes (right panel).
(H and I) University of California, Santa Cruz (UCSC) genome browser demonstrating representative epidermal differentiation TFs, NOTCH3 (H) and GRHL3 (I), that display overlapping SNAI2 and LSD1 peaks, lost LSD1 binding with GSK-LSD1, and increases in H3K4me1 and/or H3K4me2 and concomitant gene expression.

