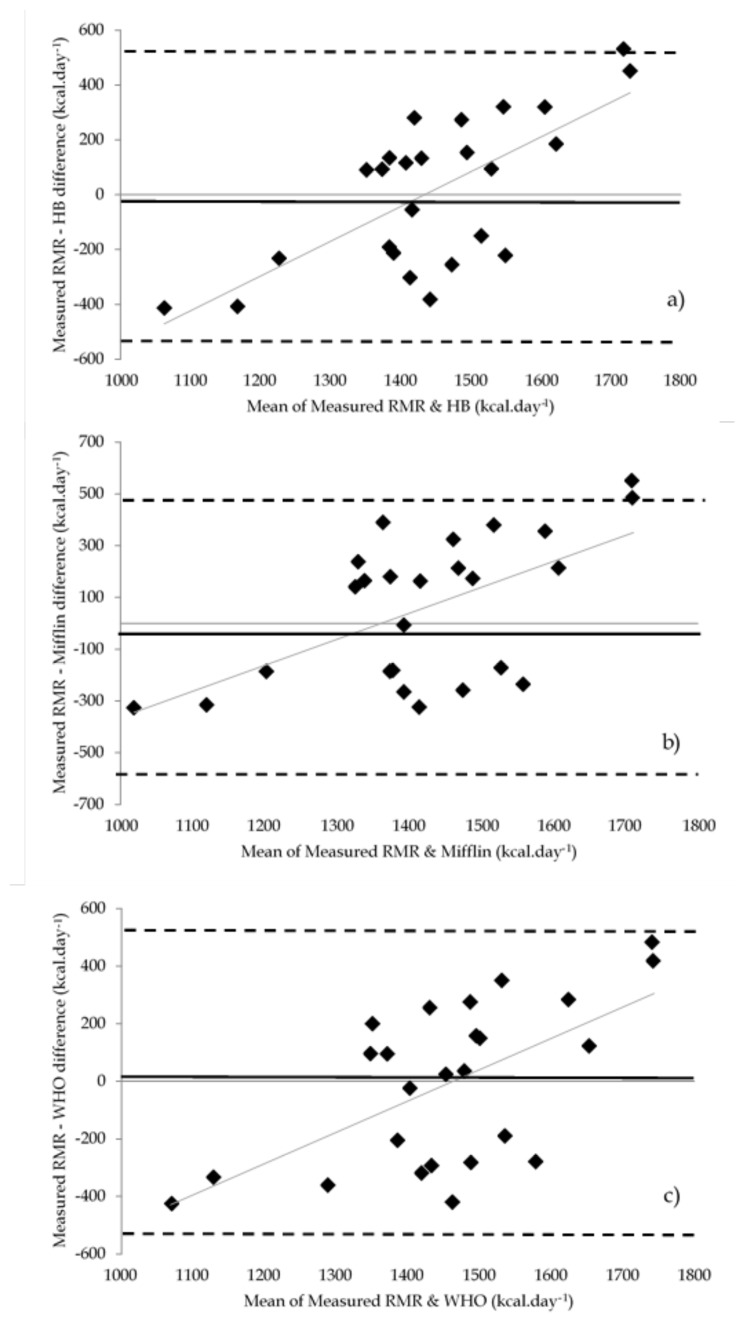
Figure 2.
The level of agreement plots (Bland-Altman) showing ± 95% limits of agreement (represented as dashed lines) between the measured RMR and each of the RMR prediction equation values in all female athletes (recreational to sub-elite): a) RMR vs. Harris-Benedict (HB); b) RMR vs. Mifflin-St Jeor (Mifflin); c) RMR vs. World Health Organisation (WHO). Solid black line represents the difference between methods. Gray line represents linear line of best fit

