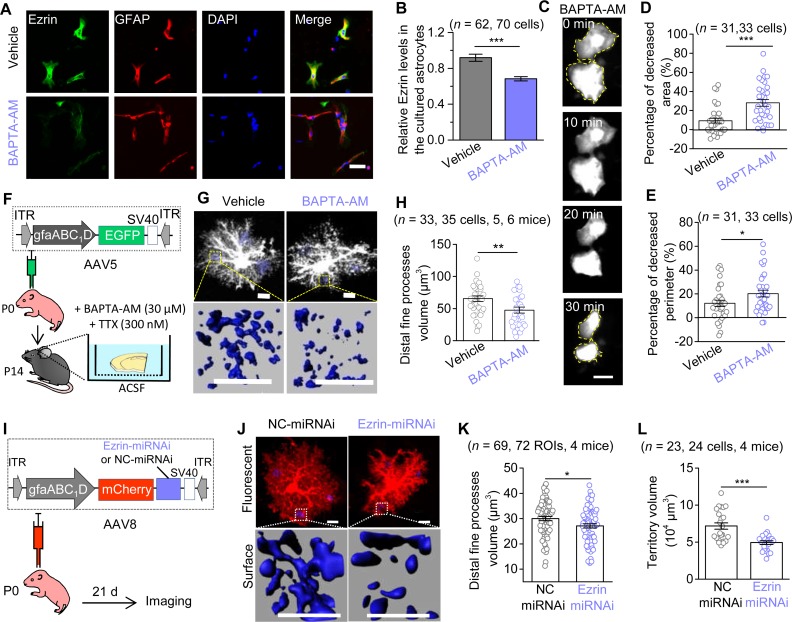
Fig 5. Reducing astrocyte intracellular Ca2+ leads to the down-regulation of Ezrin, which produces morphological deficits.
(A) Representative immunofluorescence images of Ezrin in the primary cultured astrocytes after 1-h incubation with Vehicle (DMSO) or BAPTA-AM (30 μM). Scale bars, 50 μm. (B) Quantification of relative fluorescent intensity of Ezrin (n = 3 independent preparations; P < 0.001, Mann-Whitney test). (C) Representative successive imaging of EGFP-labeled astrocytes during BAPTA-AM (30 μM) incubation. Scale bars, 50 μm. (D, E) Quantification cultured astrocytes morphology (n = 3 independent preparations; D: P < 0.001, Mann-Whitney test; E: P = 0.041, unpaired t test). (F) Diagram illustrates the vector construction, AAV injection in neonate mice, and protocol for brain slices incubation. (G) Representative fluorescent images and 3D reconstructed distal fine processes of astrocytes within a 10 by 10 by 10 μm3 ROI, 3 ROIs for one cell. Scale bars, 10 μm. (H) Quantification of astrocyte distal fine processes (P = 0.006, unpaired t test). (I) The vector construction of AAV8·gfaABC1D·mCherry·Ezrin•miRNAi (or NC-miRNAi) and stereotactic injection of AAVs into P0 mice. (J) Confocal images and 3D reconstructed astrocytes. (K) Quantification of astrocytic distal fine processes volume in NC-miRNAi and Ezrin-miRNAi mice at P21 (P = 0.018, unpaired t test). Scale bars, 10 μm. (L) Quantification of astrocyte territory volume (P < 0.001, unpaired t test). *P < 0.05, **P < 0.01, ***P < 0.001. Data are shown as mean ± SEM. Underlying data are available in S1 Data. AAV, adeno-associated virus; BAPTA-AM, 1,2-bis-(o-aminophenoxy)-ethane-N,N,N0 N0-tetraacetic acid, tetra-acetoxymethyl ester; EGFP, enhanced green fluorescent protein; GFAP, glial fibrillary acidic protein; ITR, inverted terminal repeat; miRNAi, microRNA-based RNA interference; NC, negative control; ROI, region of interest.

