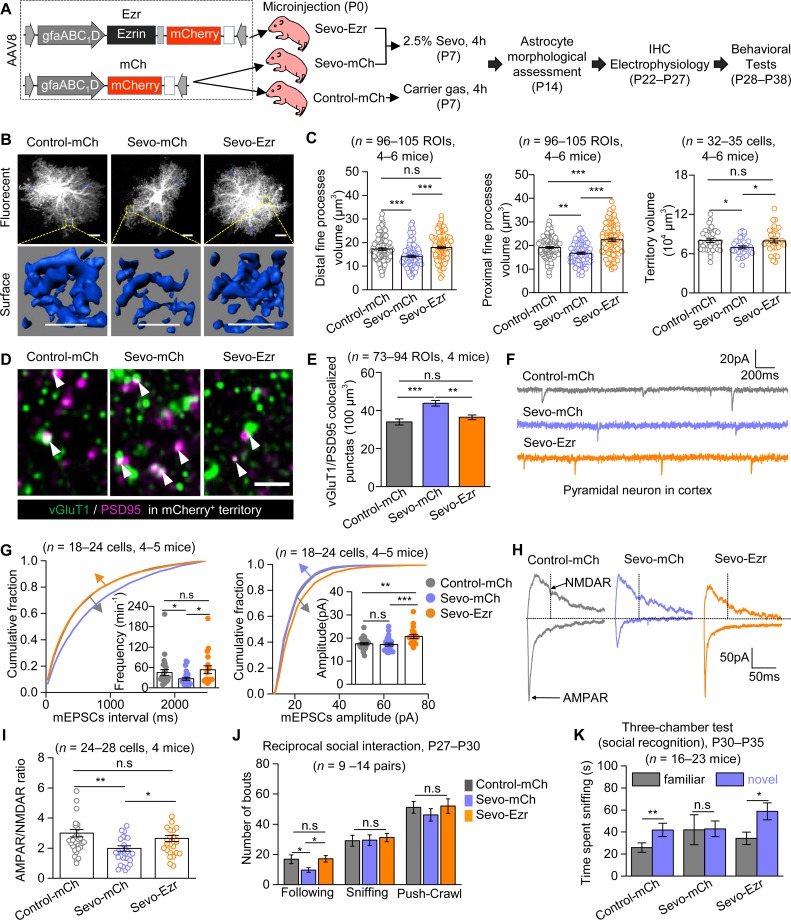
Fig 6. Ezrin overexpression was sufficient to correct cellular and behavioral deficits induced by lengthy Sevo exposure.
(A) The virus constructions of Ezr and mCh, animal grouping, and the experimental protocols. (B) Representative confocal images and 3D reconstructed distal fine processes of sparsely labeled cortical astrocytes at P14. Scale bars, 10 μm. (C) Left, quantification for experiments in B. (Left: Control-mCh versus Sevo-mCh: P < 0.001; Sevo-mCh versus Sevo-Ezr: P < 0.001; Control-mCh versus Sevo-Ezr: P = 0.303; Kruskal-Wallis test followed by post hoc multiple comparison test. Middle: Control-mCh versus Sevo-mCh: P = 0.005; Sevo-mCh versus Sevo-Ezr: P = 0; Control-mCh versus Sevo-Ezr: P < 0.001; one way ANOVA followed by post hoc Tukey test. Right: Control-mCh versus Sevo-mCh: P = 0.034; Sevo-mCh versus Sevo-Ezr: P = 0.049; Control-mCh versus Sevo-Ezr: P = 0.990; one-way ANOVA followed by post hoc Tukey test). (D) Confocal images of vGluT1 (green) and PSD95 (magenta) within mCherry-positive (mCherry+) territories in the three groups at P22–P27; the white arrows showed the vGluT1/PSD95 colocalized puncta. Scale bar, 2 μm. (E) Quantification for experiments in D (Control-mCh versus Sevo-mCh: P < 0.001; Sevo-mCh versus Sevo-Ezr: P = 0.001; Control-mCh versus Sevo-Ezr: P = 0.183; Kruskal-Wallis test followed by post hoc multiple comparison test). (F) Representative mEPSCs traces of L3-5 cortical pyramidal neurons from the three groups. (G) Left, cumulative distributions and average (Control-mCh versus Sevo-mCh: P = 0.011; Sevo-mCh versus Sevo-Ezr: P = 0.013; Control-mCh versus Sevo-Ezr: P = 0.891; Kruskal-Wallis test followed by post hoc multiple comparison test) of mEPSCs frequency. The traces of cumulative distribution of mEPSCs intervals in Control-mCh and Sevo-Ezr groups were overlapped. Right, cumulative distributions and average (Control-mCh versus Sevo-mCh: P = 0.492; Sevo-mCh versus Sevo-Ezr: P < 0.001; Control-mCh versus Sevo-Ezr: P = 0.005; Kruskal-Wallis test followed by post hoc multiple comparison test) of mEPSCs amplitude. The traces of cumulative distribution of mEPSCs amplitude in Control-mCh and Sevo-mCh groups were overlapped. (H) Representative eEPSCs traces of L3-5 cortical pyramidal neurons from the three groups at P22–P27. (I) Quantification of AMPAR/NMDAR ratio (Control-mCh versus Sevo-mCh: P = 0.002; Sevo-mCh versus Sevo-Ezr: P = 0.018; Control-mCh versus Sevo-Ezr: P = 0.490; Kruskal-Wallis test followed by post hoc multiple comparison test). (J) Quantification for reciprocal social interaction test (Control-mCh versus Sevo-mCh: P = 0.039; Sevo-mCh versus Sevo-Ezr: P = 0.020; Control-mCh versus Sevo-Ezr: P = 0.910; Kruskal-Wallis test followed by post hoc multiple comparison test). (K) Quantification for social recognition in the three-chamber test (Control-mCh: P = 0.002, paired t test; Sevo-mCh: P = 0.206, Mann-Whitney test; Sevo-Ezr: P = 0.018, Mann-Whitney test). *P < 0.05, **P < 0.01, ***P < 0.001. Data are shown as mean ± SEM. Underlying data are available in S1 Data. AAV, adeno-associated virus; AMPAR, α-amino-3-hydroxy-5-methyl-4-isoxazole propionate receptor; eEPSC, evoked excitatory postsynaptic current; Ezr, AAV8•gfaABC1D•Ezrin•P2A•mCherry; IHC, immunohistochemistry; L3-5, layer 3–5; mCh, AAV8•gfaABC1D•mCherry; mEPSC, miniature excitatory postsynaptic current; NMDAR, N-methyl-D-aspartic acid receptor; ROI, region of interest; PSD95, postsynaptic density protein 95; Sevo, sevoflurane; vGluT1, vesicular glutamate transporter 1.

