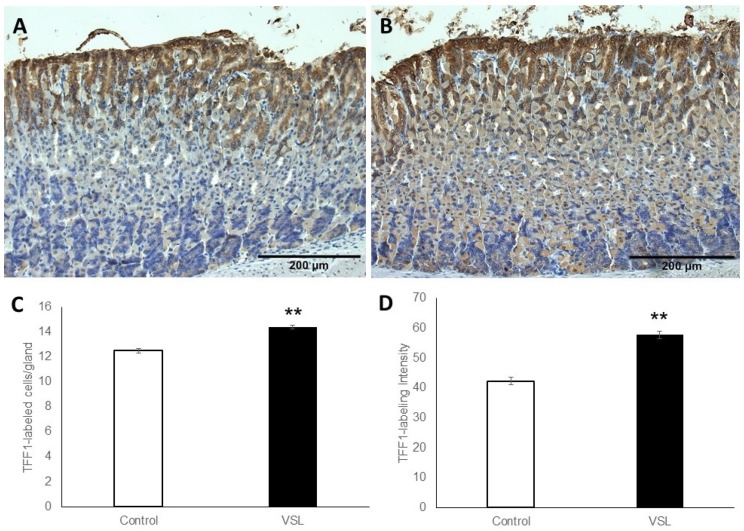
Figure 3.
Immunohistochemical analysis of TFF1 in gastric mucosal tissue sections obtained from control and VSL-treated mice. Note that TFF1-labeled epithelial cells (brown cytoplasm) of VSL-treated tissues in (B) appear more expanded at the pit region of gastric gland when compared with control tissues in (A). Magnification, 20×, scale bar: 200 µm. Analysis of TFF1-labeled cell counts per gland in the gastric corpus of control and VSL-treated mice (C), and TFF1-labeling intensity per field in the oxyntic glands of control and VSL treated mice (D). Data from four control and four VSL-mice are presented as mean ± SE. The asterisk indicates significant differences from the control group. ** p < 0.01.

