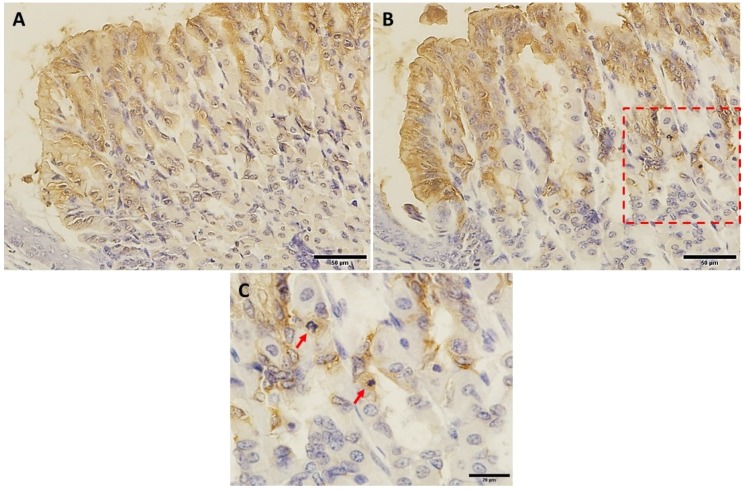
Figure 4.
TFF1-labeled epithelial cells in corresponding regions of control (A) and VSL-treated (B) gastric mucosae at high magnifications. Both A and B are taken from the same region at the junction with the stratified epithelium of the fundus (lower left corner). Note the higher intensity of the brown color of TFF1-labeling in VSL-treated tissue (B) compared to control (A). Magnification bar = 50 µm. Panel (C) shows a high magnification of the area within the red square of the VSL-tissue. Note the TFF1-labeled mitotic progenitor cells at the arrows. Magnification bar = 20 µm.

