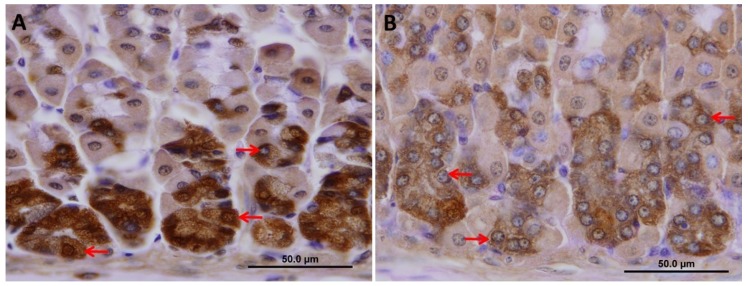
Figure 8.
A high magnification micrograph of pepsinogen immunolabeling in tissue sections obtained from the gastric mucosae of control (A) and VSL-treated (B) mice. Note the reduced pepsinogen labeling in chief cells of VSL mice at the bottom of gastric glands. These cells tend to appear smaller than those of control with a less amount of secretory granules (arrows in A vs. B). Magnification bar = 50 µm.

