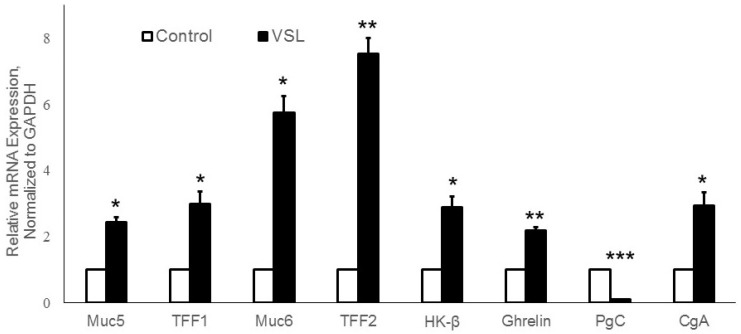
Figure 12.
Quantitative RT-PCR analysis of mRNA expression of VSL–treated tissues versus control tissues. Expression of TFF1, TFF2, Muc5ac, Muc6, H+,K+-ATPase β subunit, ghrelin, CgA and PgC in VSL and control tissues were compared. Data from three different pairs of control and VSL-treated mice were presented as mean ± SE and normalized to GAPDH. The asterisks indicate significant differences from the control group. * p < 0.05; ** p < 0.01; *** p < 0.001.

