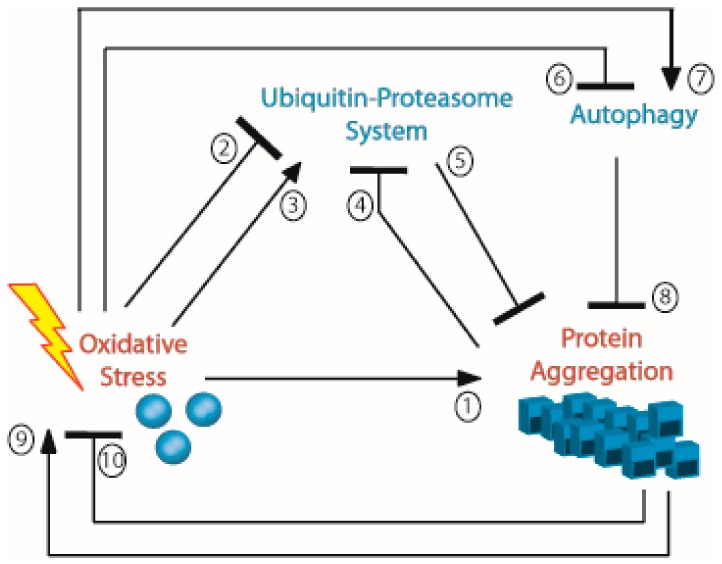
Figure 3.
General diagram showing the regulation of protein aggregation. Arrows indicate the activation relationship, and blunt-ended arrows indicate the repression relationship. References supporting this diagram within this review are as follows: 1: [20,21,24,28,31,32,35,41,42,43,44,45,46,47,49,50]; 2: [58,61]; 3: [57]; 4: [62,63]; 5: [51,52,53,54,55]; 6: [80]; 7: [74,75,76,77,78,79,80]; 8: [64,65,66,67,68,69,70,71,72,73,82,83,84]; 9: [47,88,89,90,91,92,93,94,95,96,97,98,99]; 10: [100,101,102,103,104,105,106,107].

