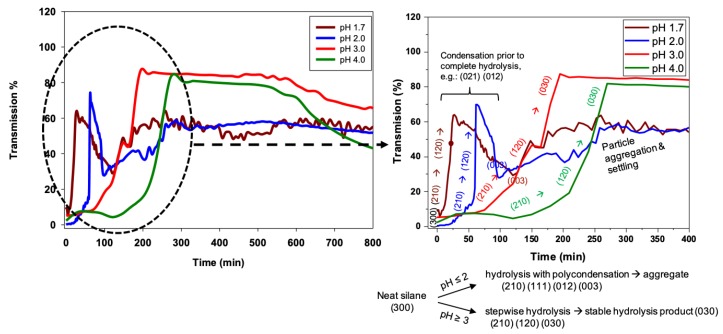
Figure 7.
Hydrolysis and condensation kinetics of 3F (0.4 M) based on transmissivity, using Turbiscan-analyzed data at pH 1.7, 2.0, 3.0, and 4.0. Transmissivity data for different pH are taken at the height where transmissivity is the lowest at the beginning due to the presence of 3F. A zoomed figure in the right shows how the chemical transformation occurred in 3F during the hydrolysis and condensation process.

