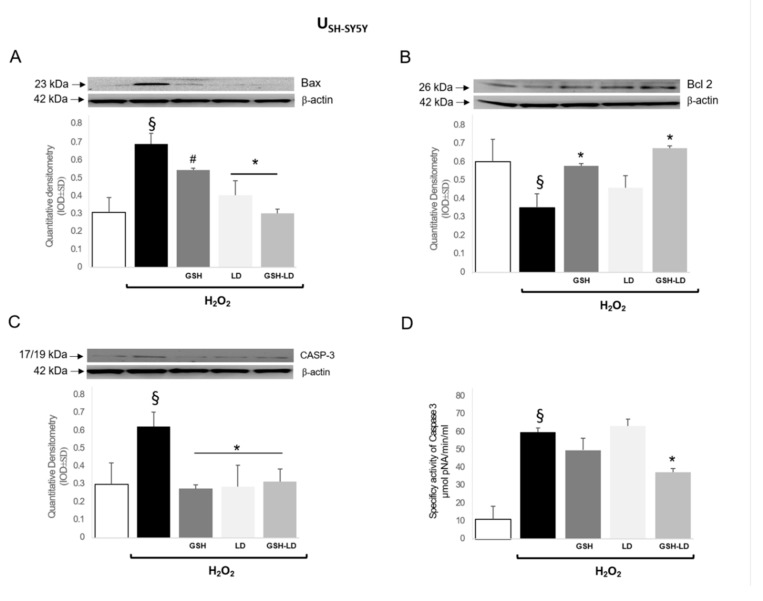
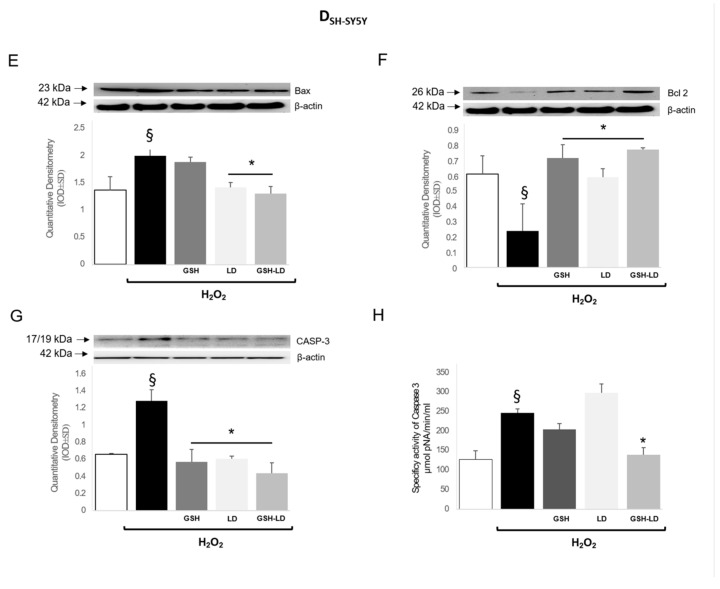
Figure 6.
Effects of compounds on expression levels of apoptosis related proteins in the neuroblastoma cell line. Effect of GSH, LD and GSH-LD (1 μM), on the expression levels of Bax (A,E) and Bcl-2 (B,F) and on caspase 3 expression and fluorescent activity (C,D,G,H), on H2O2-treated USH-SY5Y (upper) and DSH-SY5Y (lower) cells. ß-actin was used as internal standard. Data are presented as the mean ± SD (n = 6), § p < 0.05 vs. CTRL; # p < 0.05 and * p < 0.01 vs. H2O2-treated cells.


