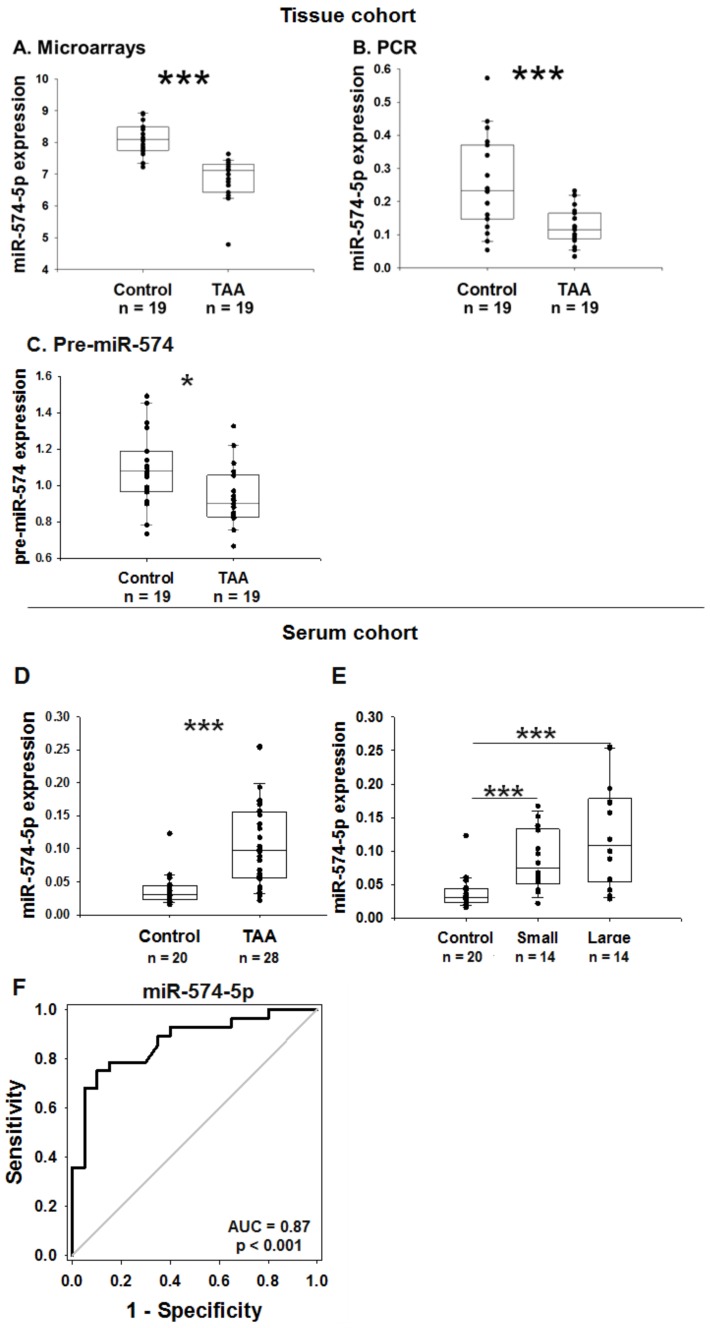
Figure 2.
MiR-574-5p and pre-miR-574 expression in aortic tissues from the tissue cohort (A–C); and the association between serum levels of miR-574-5p and TAA in the serum cohort (D–F). (A) Microarray data. (B,C) Quantitative PCR data. * p < 0.05, *** p < 0.001 versus control. (D) Expression of miR-574-5p in the serum of TAA and control patients from the serum cohort. (E) Expression of miR-574-5p according to the size of the aneurysm. The small group includes patients with an aneurysm < 49 mm and the large group includes patients with an aneurysm > 49 mm. TAA: Thoracic aortic aneurysm. *** p < 0.001. (F) ROC (receiver operating characteristic) curve analysis showing the association between serum levels of miR-574-5p and TAA. AUC: Area under the curve.

