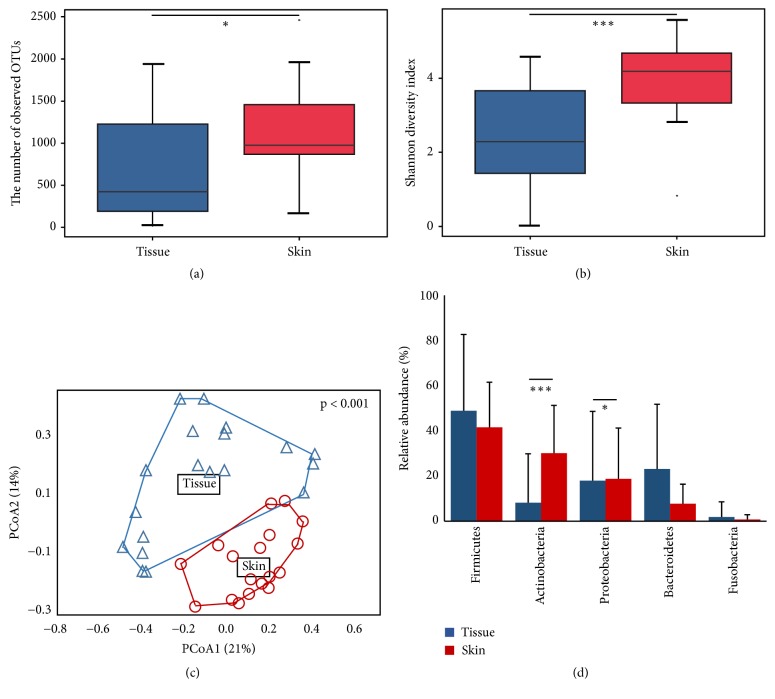
Figure 2.
Comparison of microbiota between normal foot skin and diabetic foot wound tissue. (a) Number of observed OTUs and (b) Shannon diversity index of microbiota were compared using boxplot. Median values and lower/upper quartiles were shown in boxplot. (c) Difference in microbiota between skin and tissue samples was analyzed in PCoA plot based on Bray-Curtis distance. P value in PCoA plot was calculated by permutation test. (d) Composition of phylum was compared between groups. Mean values and standard deviations were shown in bar-chart. The significance of differences between groups was calculated by Mann-Whitney U-test (∗p < 0.05, ∗∗∗p < 0.001).

