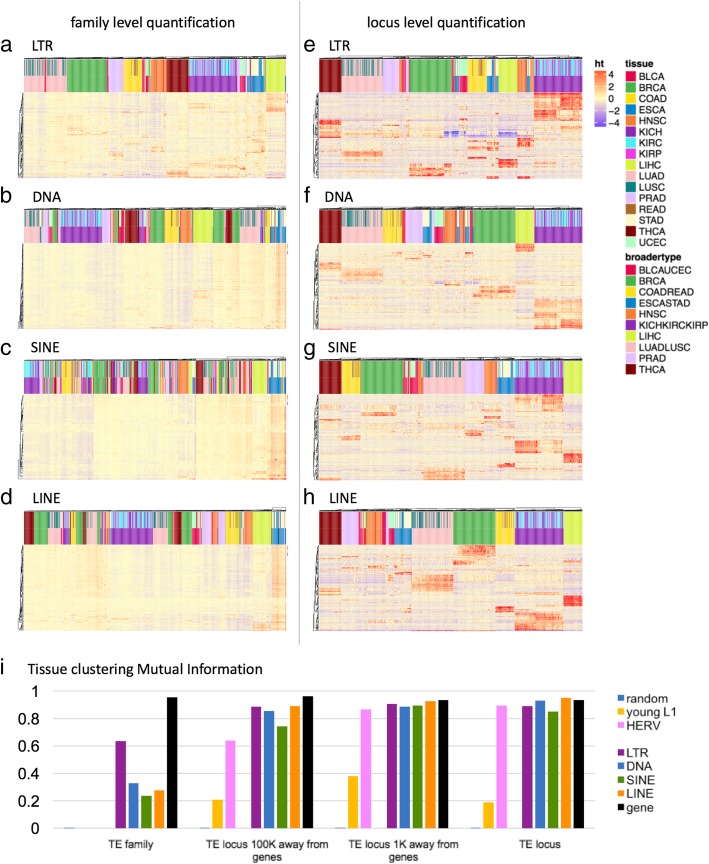
Fig. 3.
Tissue clustering based on transposable elements. Heatmap showing the tissue clustering results based on the top 150 TEs with the largest variance of each class. With the color bars at the top of the heatmap, the upper color labels show tissue types and the lower color labels show broader tissue groupings. a–d clustering based on family level quantification. e–h clustering based on locus level quantification. i Clustering quality measured by Mutual Information for clustering results based on family level TE quantification, locus level quantification for TEs 100Kb away from genes, locus level quantification for TEs 1Kb away from genes, and locus level TE quantification without filtering for gene proximity

