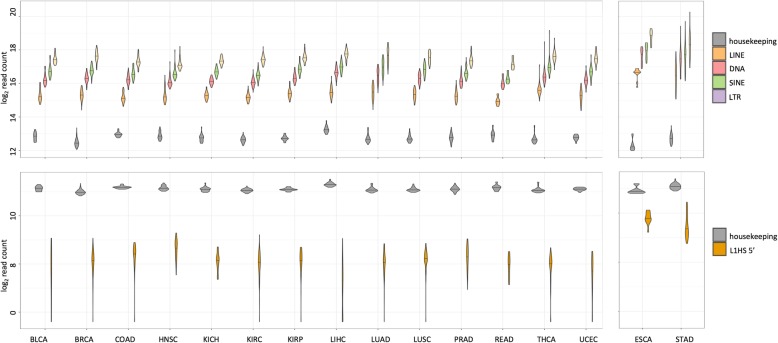
Fig. 5.
Variation in TE expression across tissues and individuals. a Normalized and log-transformed sum of all read counts mapping to the TEs of each class, LINE, DNA, SINE and LTR are shown as violin plots. Mean read count of a set of housekeeping genes (Additional file 1: Table S6) are plotted as a reference. Horizontal line across the violin plot represents the median value across all samples of that tissue type. b Normalized and log-transformed sum of all read counts mapping to 300 bp at the 5′ end of L1HS are plotted as a violin plot. Same set of housekeeping genes used in a. are plotted as a reference

