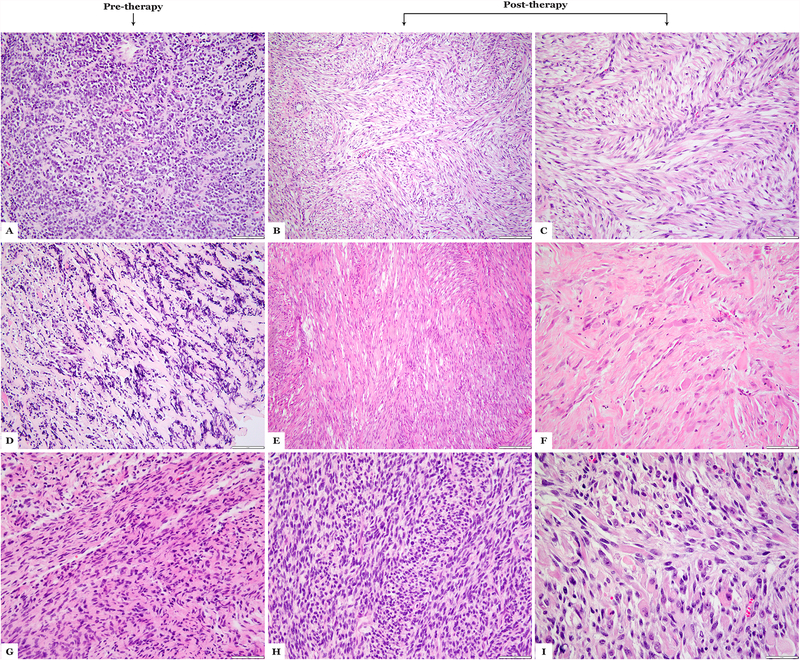
Figure 3:
Morphologic spectrum of MYOD1-mutant rhabdomyosarcoma following therapy. (A-C) Case 4 showing sclerosing areas on the pre-therapy biopsy (A), while in the post-therapy resection (B,C) showing pure spindle cell morphology; (D-F) Case 12 showing a sclerosing morphology in the pre-therapy biopsy (D), while the post-therapy resection reveals a spindle cell morphology (E) and areas of maturation with rhabdomyoblastic morphology (F); (G-I) Case 24 showing spindle cell morphology on pre-therapy biopsy (G), while post-therapy resection shows cellular spindle cell areas (H) and areas of maturation (I). (H&E stains)

