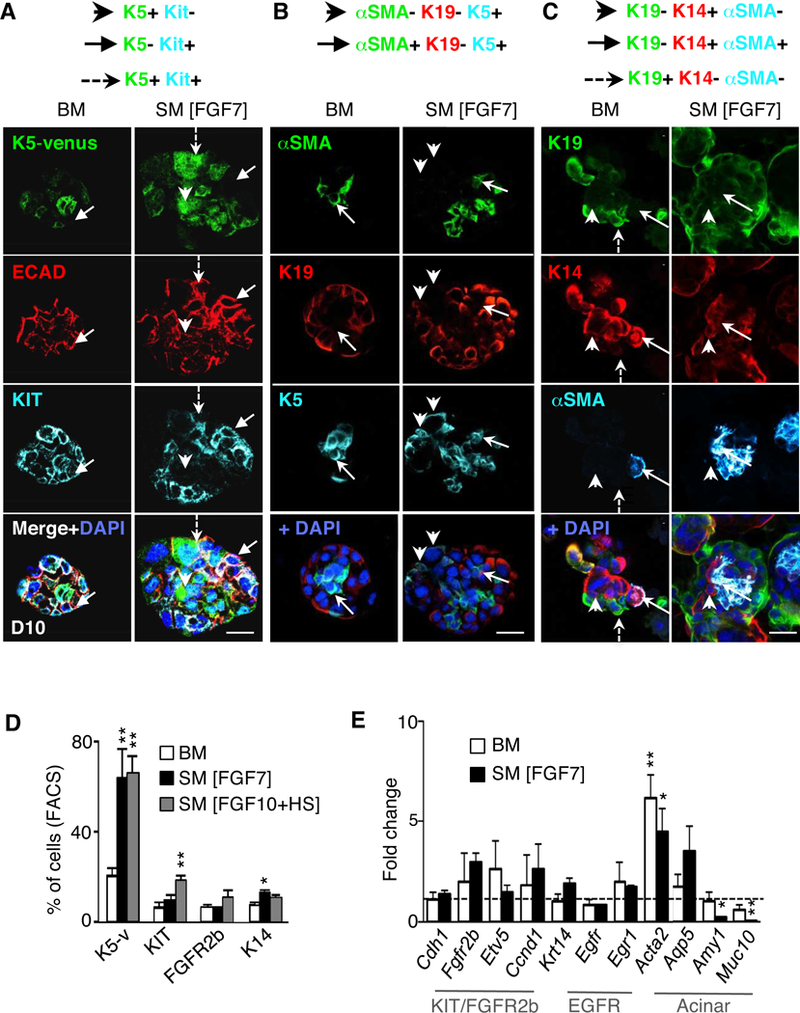
Figure 2. Fetal cues in adult murine salisphere culture (SM) reduce expression of secretory markers and increase cell number of various progenitors.

(A-C) Images of 10 μm confocal sections through D10 salispheres cultured in BM or SM [FGF7], (A) showing K5-venus expression with staining for E-cadherin (ECAD, red), KIT (cyan) and/or nuclei (DAPI, blue). Arrowhead, K5+KIT- cells. Arrow, K5-KIT+ cells. Dotted arrow, K5+KIT+ cell. (B-C) confocal analysis of αSMA (myoepithelial marker), K19 (ductal marker), endogenous K5, K14, and/or nuclei (DAPI, blue). (B) arrows indicate αSMA+K19-K5+ cells, arrowheads indicate αSMA-K19-K5+ cells. (C) arrows represent K19-K14+αSMA+ cell; arrowheads indicate a K19-K14+αSMA- cell. Dotted arrow shows K19+ duct cell. Scale bar, 50 μm. (D) FACS analysis (% of total cells) of D10 salispheres cultured in BM, SM [FGF7] or SM [FGF10+HS] media. N=3 biological samples. Mean±SEM. *, P<0.05, **, P<0.01, one-way ANOVA with post-Dunnett test compared to BM D10. (E) Gene expression of D10 salispheres in BM or SM [FGF7], normalized to Rsp29 and D3 BM salispheres (--). N=3 biological samples. Mean±SEM. *, P<0.05, **, P<0.01, one-way ANOVA with post-Dunnett test.
