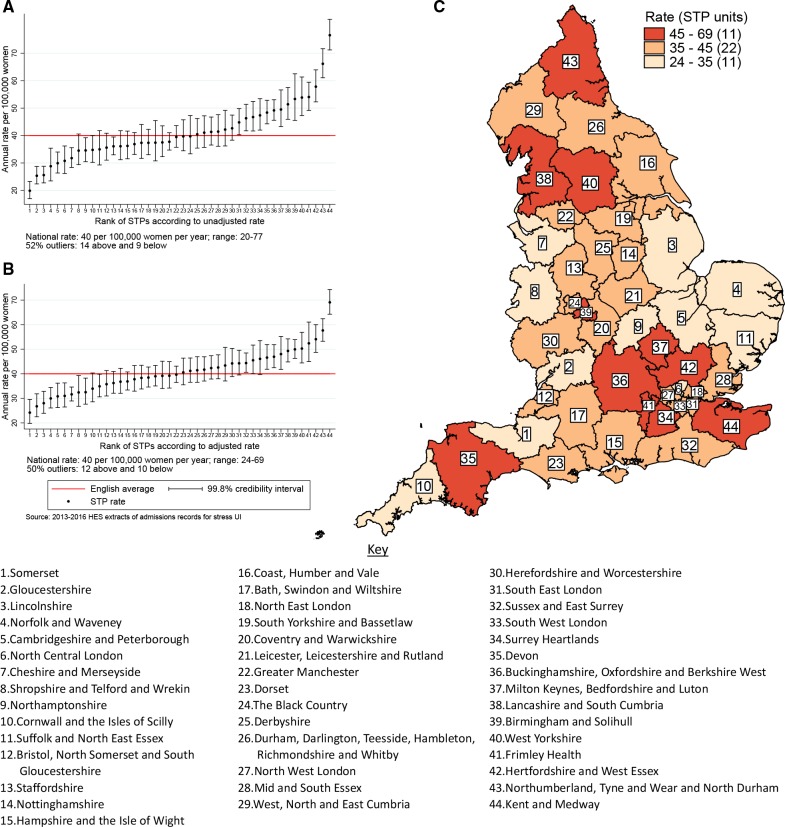
Figure 3.
STP-level rates of stress urinary incontinence procedures between 2013 and 2016. The figure shows the EB estimated procedure rates for stress urinary incontinence. The vertical axes in (A) and (B) are EB rates. Rates in (B) are risk-adjusted for age, socioeconomic status, ethnicity and long-term illness. The numbers on the horizontal axis represent the assigned position of the STP footprint ranked according to rates. Geographical mapping in (C) highlight the locations of STP footprints with the lowest to highest range of procedure rates. EB, empirical Bayes; STP, Sustainability and Transformation Partnership.

