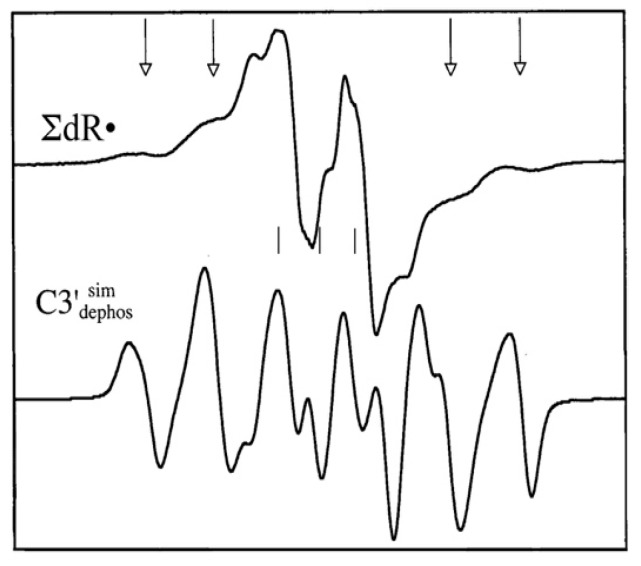
Figure 12.
Experimental ESR spectrum of sugar radicals in Kr-86 ion beam irradiated DNA (∑dR•) and simulated spectrum of C3′•dephos using parameters given in narrative. The arrows indicate the positions of the outer four lines of C3′•dephos in the experimental spectrum (top). Adapted from reference [98] with permission from Radiation Research, 2019 Radiation Research Society.

