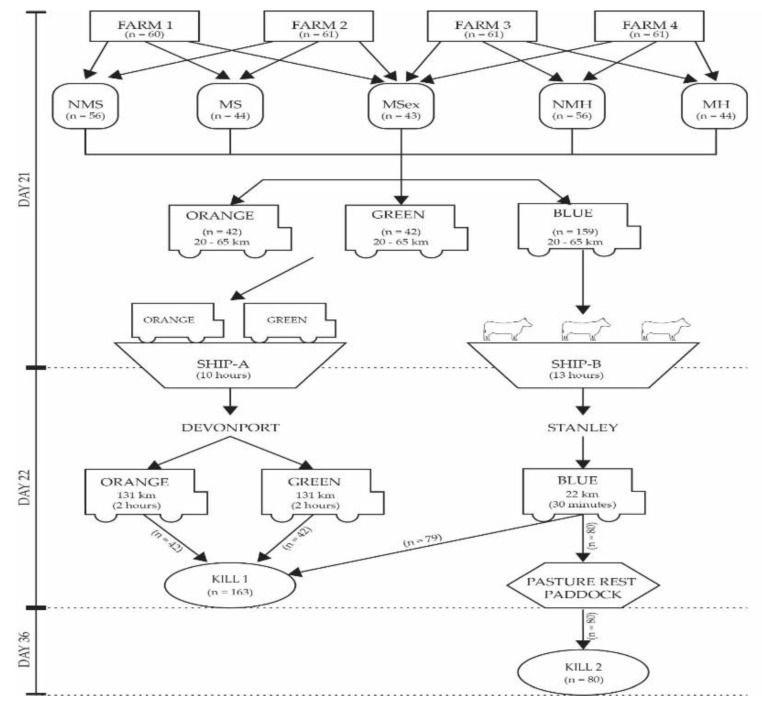
Figure 1.
Experiment One diagram of timeline methodology for mixing, transport and slaughter interval. NMS, never mixed steers; NMH, never mixed heifers; MS, mixed steers; MH, mixed heifers; MSex, mixed steers and heifers. The truck symbol denotes trucking pathway and cattle symbol denotes cattle were unloaded and on foot rather than in trucks. The arrows represent the direction of cattle movement and dotted lines represent timeline. Any parameter that intersects the dotted line occurred over multiple days.

