Figure 1.

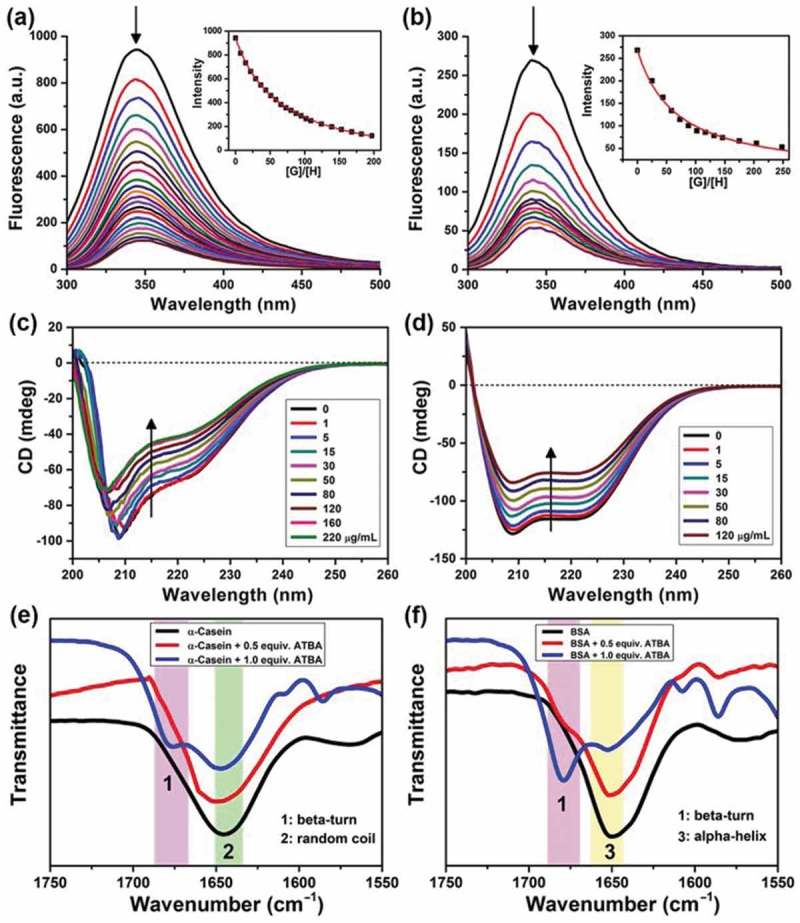
(a,b) Fluorescence spectra of α-casein (a) or BSA (b) with the addition of various equivalents of ATBA monomers in Tris-HCl buffer solution (1 mmol·L‒1) at pH 7.4 and 20°C; the protein concentration was 20 μg·mL‒1 or 30 μg·mL‒1 for α-casein or BSA, respectively. (c,d) Circular dichroism spectra of α-casein (c) or BSA (d) with the addition of various amounts of ATBA in Tris-HCl buffer solution (1 mmol·L‒1) at pH 7.4 and 20°C; the protein concentration was 150 μg·mL‒1 or 70 μg·mL‒1 for α-casein or BSA, respectively. (e,f) Representative FTIR spectra of the amide I band of α-casein (e) and BSA (f) after interaction with ATBA in D2O at 20°C (the colour bands in the figure illustrate three characteristic peaks corresponding to the secondary structures of the proteins, 1: ß -turn, 2: random coil, 3: α-helix).
