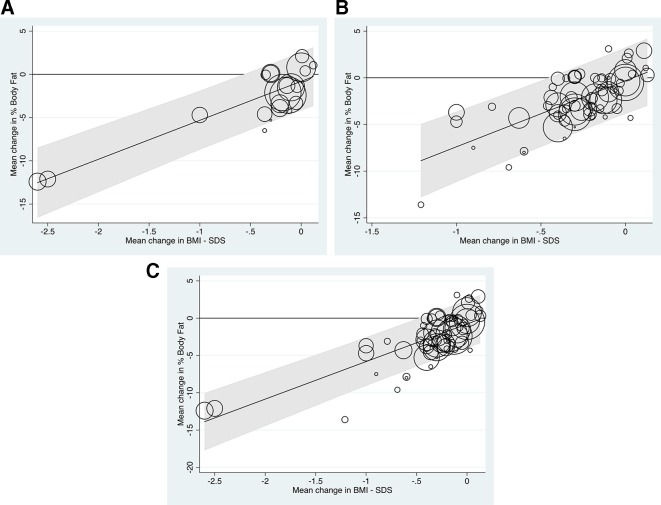
Figure 5.
Sensitivity analysis. BMI-SDS, body mass index- SD score. (A) Analyses based on the 22 subsets where the SEs of the mean changes in percentage Body Fat were known (Fitted meta-regression line: Mean change in % body fat = 4.502 x Mean change in BMI-SDS – 0.810). (B) Analysis using all data subsets but excluding two extreme values (reduction of mean BMI-SDS of more than 1.5), leaving 64 subsets (Fitted meta-regression line: Mean change in % body fat = 7.078 x Mean change in BMI-SDS – 0.318). (C) Analysis using all 66 data subsets but using a correlation coefficient of 0.50, rather than 0.81, to estimate the SE of the mean change in % Body Fat for the 66–22=44 subsets where this was not available (Fitted regression line: Mean change in % body fat = 5.039 x Mean change in BMI-SDS - 0.783).

