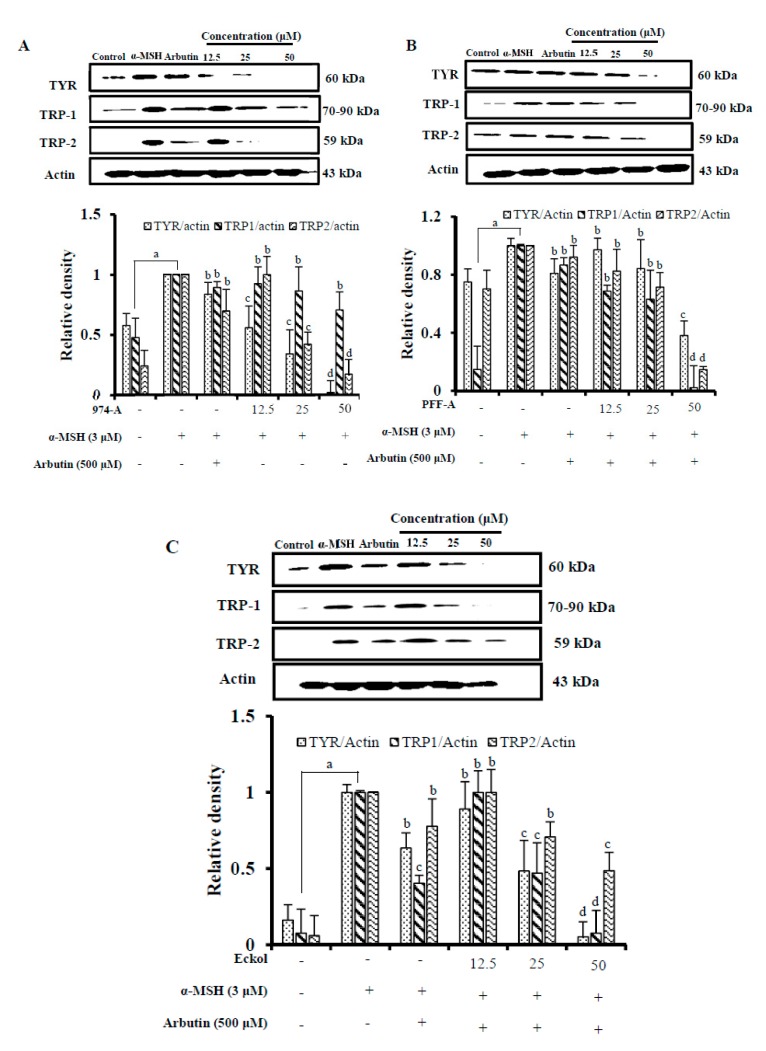
Figure 4.
Effect of different concentrations of 974-A (A), phlorofucofuroeckol-A (PFF-A) (B), and eckol (C) on tyrosinase (TYR), tyrosinase related protein-1 (TRP-1), and TRP-2 expression level in α-MSH. Cells were pretreated with the indicated concentration of 974-A, phlorofucofuroeckol-A (PFF-A), eckol along with α-MSH and arbutin for 24 h. Western blotting was performed and protein band intensities were quantified by densitometric analysis using CS analyzer Eng software. Upper panels display representative blots. Equal protein loading was ensured and normalized against β-actin levels. Data represent the mean ± SD of three independent experiments. a p < 0.01 indicates significant differences from the normal control group (no treatment); b p < 0.05, c p < 0.01, and d p < 0.001 indicate significant differences from the α-MSH treated group.

