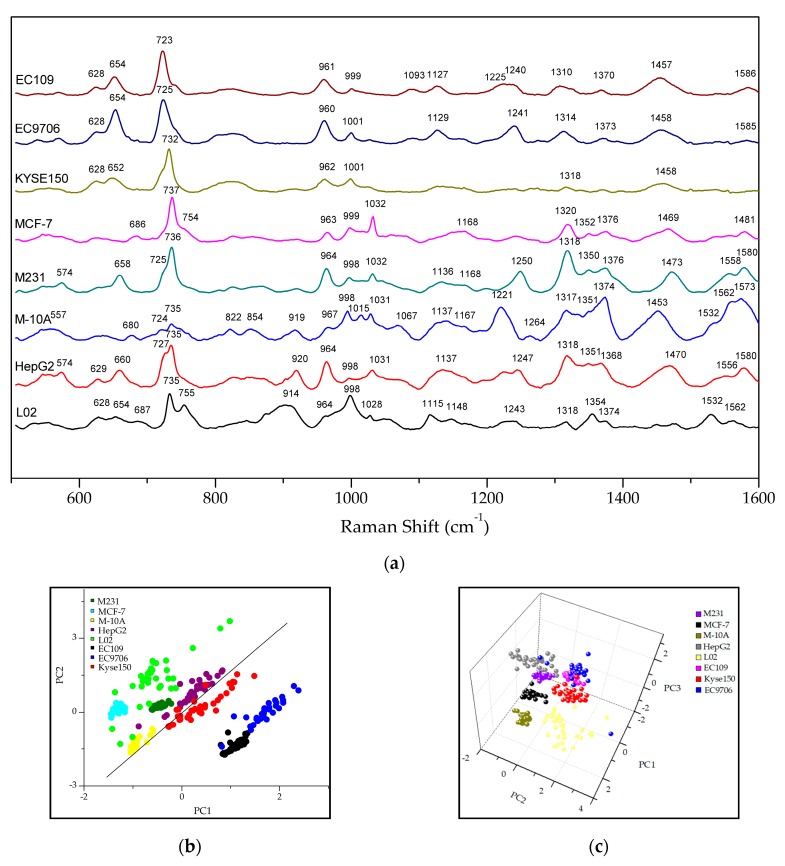
Figure 3.
The Raman phenotypes of exosomes derived from eight different cell types. (a) Exo-SERS acquired from EC109, EC9706, Kyse150, MCF-7, M231, M-10A, HepG2 and L02 cells; (b) The two-dimensional scatter plot of PC1 (48.98%) and PC2 (23.49%) showed that the esophageal cancer cell-derived exosomes were absolutely distinguished from other cell derived exosomes by selecting the 600–760 cm−1 region; (c) Three-dimensional scatter plot of PC1 (50.03%), PC2 (12.24%) and PC3 (8.12%) showed that the breast cell-derived exosomes were absolutely distinguished from other cell derived exosomes by selecting the 940–1100 cm−1 region.

