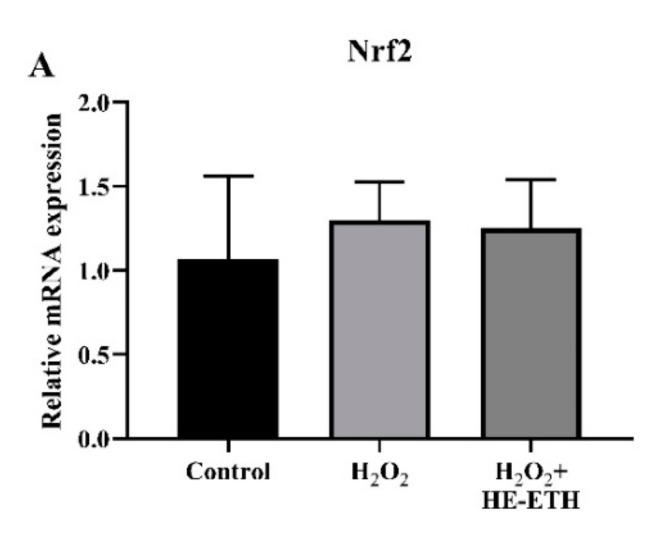
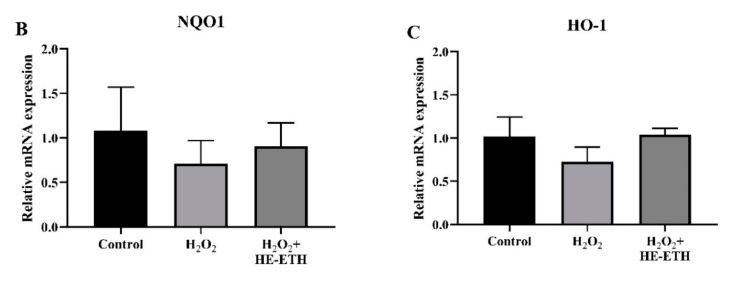
Figure 8.
Analysis of transcriptional expression measured by qPCR. HT22 was co-incubated with 250 μM H2O2 and 400 μg/mL ethanolic extract (HE-ETH) before subjected to qPCR for quantification of (A) nuclear factor erythroid 2-related factor 2 (Nrf2), (B) NAD(P)H quinone dehydrogenase 1 (NQO1) and (C) heme oxygenase-1 (HO-1) mRNA expression. All values presented correspond to mean ± SD of triplicates (n = 3).


