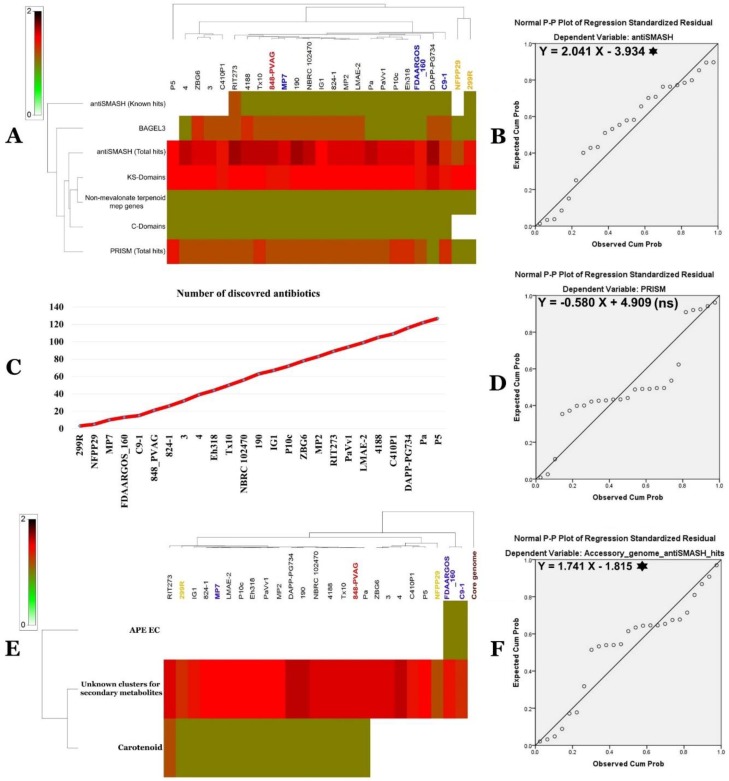
Figure 11.
Secondary metabolite arsenal of P. agglomerans and P. vagans isolates and its relationship to genome size and accessory genomes. (A) Genome mining of secondary metabolite clusters illustrated by a heat map. (B) Linear relationship between antiSMASH total hits and genome sizes (*: statistically significant at p < 0.05). (C) Evolution of the number of discovered secondary metabolites in relation to the number of genomes sequenced. (D) Linear relationship between PRISM total hits and genome sizes (statistically non-significant). (E) Genome mining of secondary metabolite clusters in P. agglomerans and P. vagans accessory genomes illustrated by a heat map. (F) Linear relationship between antiSMASH total hits and sizes of the accessory genomes (*: statistically significant at p < 0.05).

