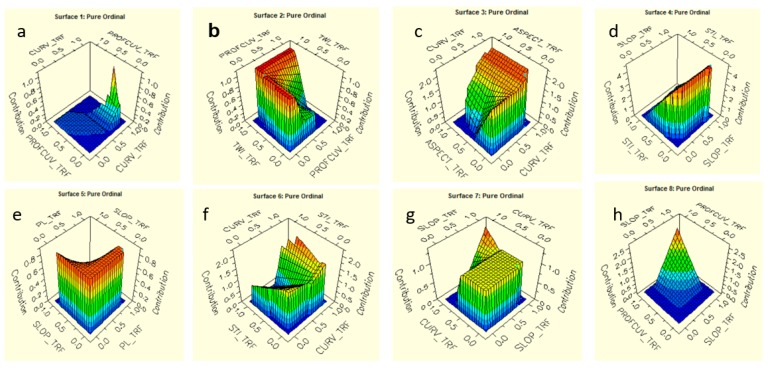
Figure 6.
Response surface curve—Relationship between individual independent variable and the contribution of the target variable for (a) Total curve and profile curvature, (b) TWI and profile curvature, (c) Aspect and total curvature, (d) STI and slope gradient, (e) Slope gradient plan curvature, (f) STI and curvature, (g) total curvature and Slope gradient, and (h) profile curvature and slope angle.

