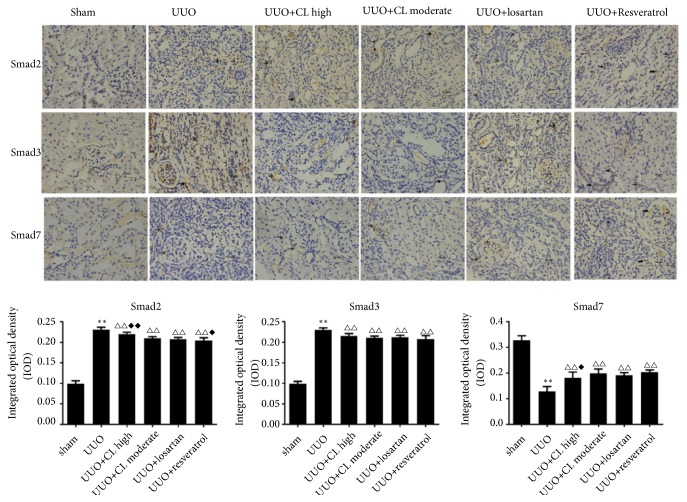
Figure 7.
Cili decreases the protein expression of Smad2 and Smad3 and increases the expression of Smad7 in kidneys after UUO. Representative immunohistochemistry images of key proteins in the Smads signaling in kidneys are shown with quantification. Scale bar: 10 μm. Positive staining is indicated by arrows. N=12/group. The results are expressed as mean ± SD. ∗∗P<0.01 vs. the sham group; △△P<0.01 vs. the UUO group; ◆P<0.05 vs. the losartan group.

