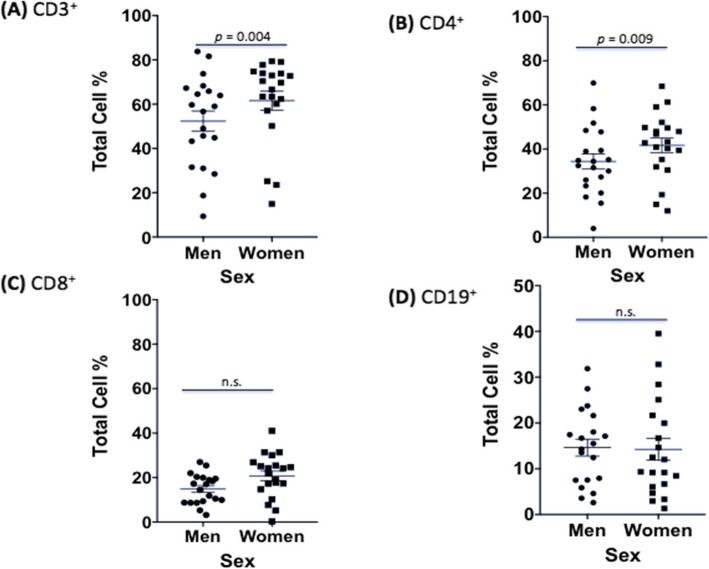
Fig. 5.
Differences in immune response between sexes in uninfected PBMCs (first dataset). Mean cell percentages for the T cell markers, a CD3+, b CD4+, c CD8+, and d the B cell marker, CD19+, in PBMCs from healthy men and women after a 7-day incubation as measured by cytometric analysis. The total percentage given for each marker represents the total percentage of cells expressing the antigen indicated. N = 40 (21 males and 19 females). This experiment was done in triplicate and the results averaged to create each data point. Data was analyzed using MANOVA with simple contrasts. Error bars are SE; n.s. not significant

