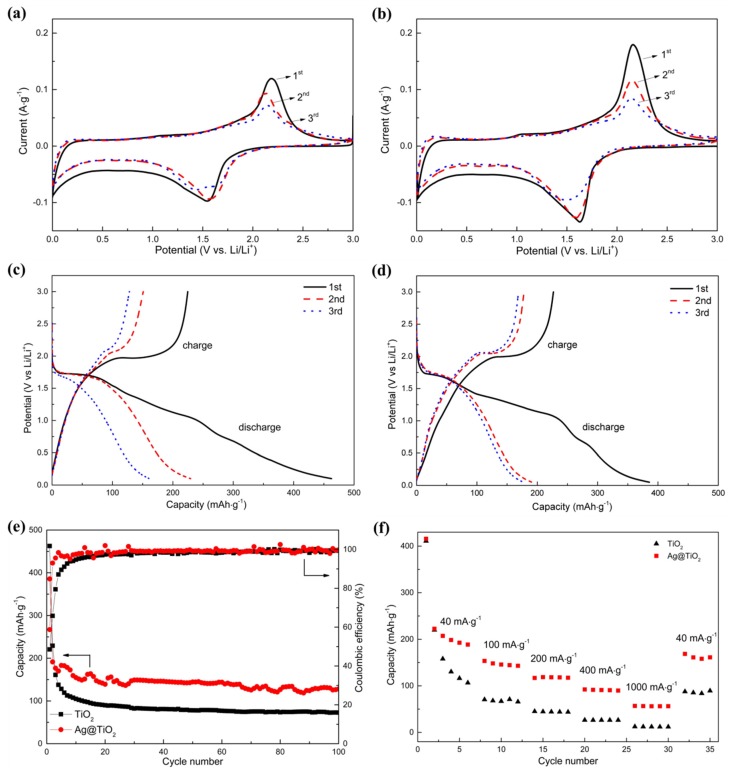
Figure 7.
Electrochemical performances of TiO2 and Ag@TiO2 nanofibers electrodes. Cyclic voltammograms of (a) TiO2 nanofibers electrode and (b) Ag@TiO2 nanofibers electrode from the first to third cycle at a scanning rate of 0.1 mV/s between 0–3 V. First three charge and discharge cycles of (c) TiO2 nanofibers electrode and (d) Ag@TiO2 nanofibers electrode. (e) Cycling performance at 100 mA⋅g−1. (f) Rate capability of TiO2 and Ag@TiO2 nanofibers electrodes at different current densities.

