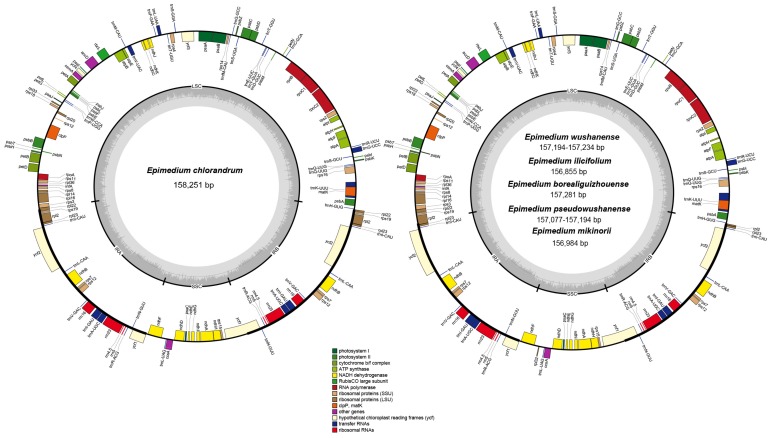
Figure 1.
Gene map of the complete plastid genomes of E. wushanense and its closely related species. Genes drawn inside the circle are transcribed clockwise, whereas those outside are transcribed counterclockwise. The darker gray in the inner circle corresponds to the GC content, whereas the lighter gray corresponds to the AT content.

