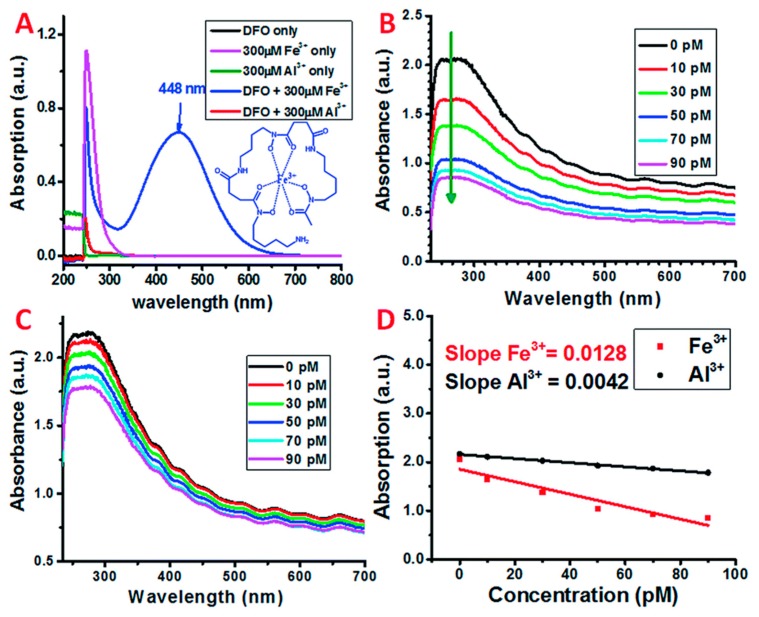
Figure 4.
(A) UV-Visible spectra of Deferoxamine (DFO) only, Fe3+ only, Al3+ only, DFO + Fe3+, and DFO + Al3+ solution in nitric acid (pH = 2). (B,C) UV-Vis spectra of SWNT/PL-PEG-DFO in the presence of (black) 0 pM, (red) 10 pM, (green) 30 pM, (blue) 50 pM, (cyan) 70 pM, and (magenta) 90 pM Fe3+ and Al3+ standard solutions, respectively. (D) The decrease in the absorption of SWNT/PL-PEG-DFOs at 270 nm as a function of the increase in the concentration of Fe3+ and Al3+. UV-Vis-NIR spectrum. Reprinted with permission from [76]. Copyright 2016 Royal Society of Chemistry.

