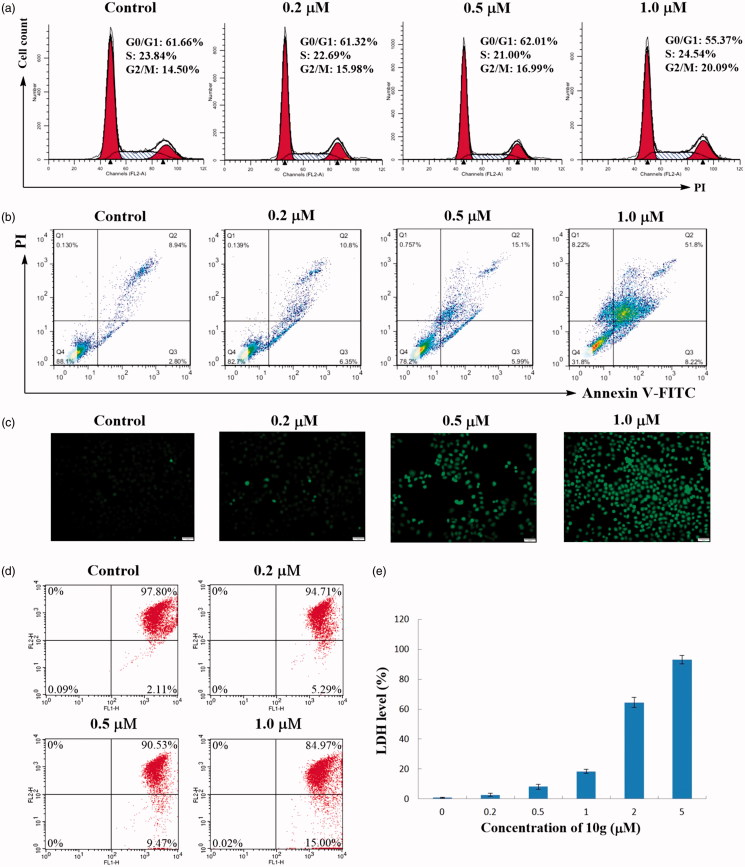
Figure 5.
(a) Cell cycle assay. HepG2 cells were treated with different concentrations of compound 10g (0, 0.2, 0.5, 1.0 μM) for 48 h, stained with propidium iodide (PI) and analysed using flow cytometer. (b) Annexin V-FITC/PI dual staining assay. HepG2 cells were treated with different concentrations of compound 10g (0, 0.2, 0.5, 1.0 μM) for 48 h, stained with Annexin V-FITC/PI and analysed for apoptosis using flow cytometer. (c) ROS generation assay. HepG2 cells were treated with different concentrations of compound 10g (0, 0.2, 0.5, 1.0 μM) for 48 h, stained with DCFH-DA and analysed using flow cytometer. (d) Mitochondrial membrane potential assay. HeLa cells were treated with compound 4d (0, 0.2, 0.5, 1.0 μM) for 24 h, incubated with JC-1 and analysed using flow cytometry. (e) LDH release assay of HepG2 cells treated with different concentrations of compound 10g (0, 0.2, 0.5, 1, 2 and 5 μM).

