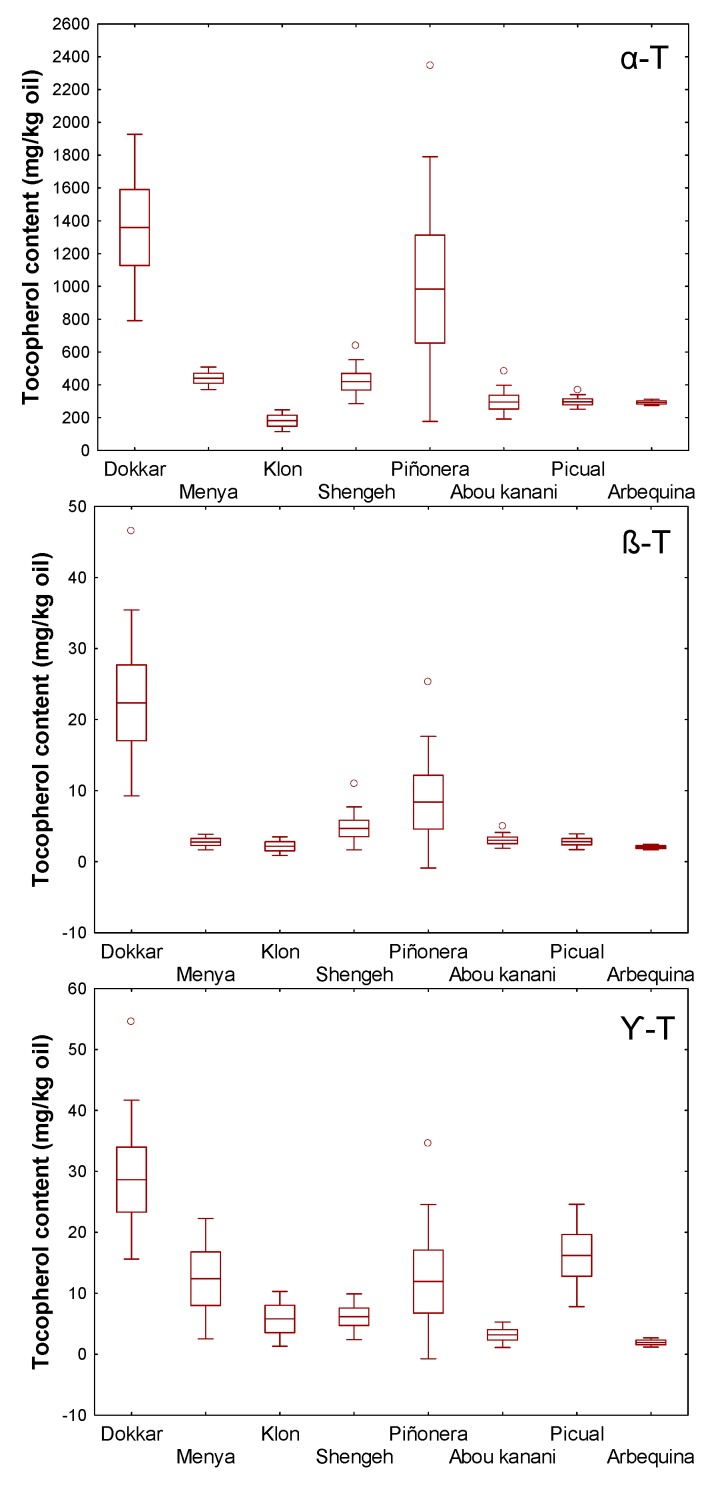
Figure 4.
Variability across years for the contents (mg/kg oil) of the three forms of tocopherol in the oils from selected cultivars from WOGC: α-T, α-tocopherol; β-T, β-tocopherol; γ-T, γ-tocopherol. Horizontal inner lines in the boxes are mean values. The height in a box is equal to the standard error and the whiskers to standard deviation. The outliers (open dots) are indicated outside the whiskers.

