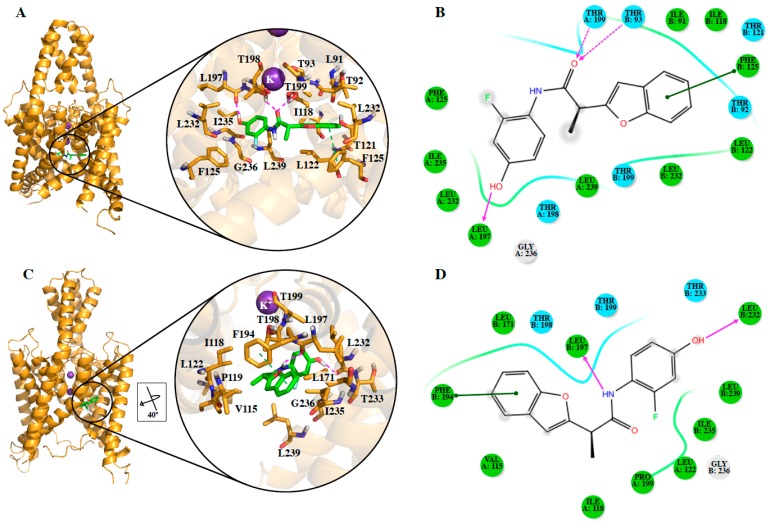
Figure 3.
DR16 binding mode in TASK-3. Lead ligand DR16 interaction with T3-treCC (A,B) and T3-twiOO (C,D) models. For better representation, 2D diagrams are shown. H-bonds are represented as purple lines, and π–π stacking interactions as green lines. In the 2D diagrams (B,C), polar and hydrophobic residues are colored in cyan and green, respectively.

