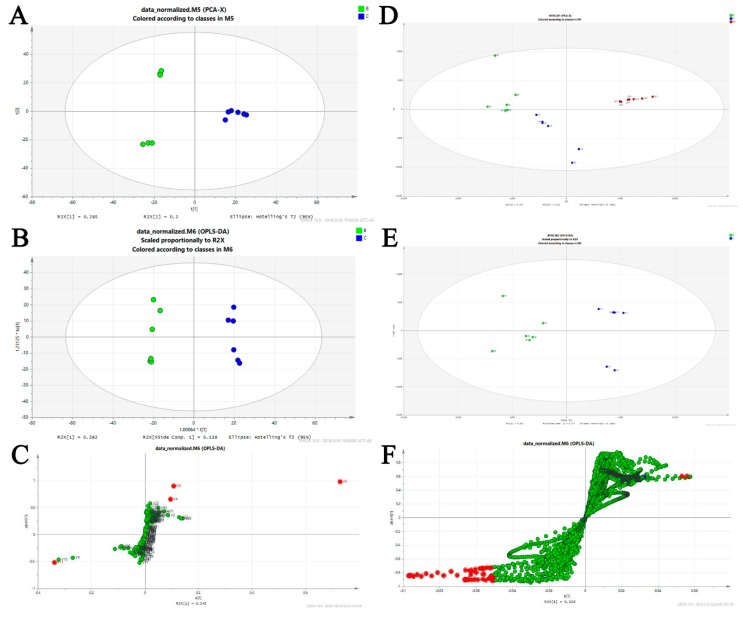
Figure 6.
Biomarker identification and altered metabolic pathways regulated by BA-12. For GC–MS metabolomics: (A) score plots of control (C group, PBS) and BA-12 (B group, 2.5 μM) from principal component analysis (PCA) for principal component 1 (PC1) versus PC2; (B) score plots of control (C group, PBS) and BA-12 (B group, 2.5 μM) from orthogonal projections to latent structures discriminant analysis (OPLS-DA) model for the pairwise comparisons; (C) S-plot of the OPLS-DA model for the B and C groups. The points in red indicate the identified biomarkers. For UPLC–TOF-MS metabolomics: (D) score plots of control (C group, PBS) and BA-12 (B group, 2.5 μM) from PCA in the positive electrospray ionization (ESI+) mode for PC1 versus PC2; (E) score plots of control (C group, PBS) and BA-12 (B group, 2.5 μM) from OPLS-DA model for the pairwise comparisons; (F) S-plot of the OPLS-DA model for the B and C groups. The points in red indicate the identified biomarkers.

