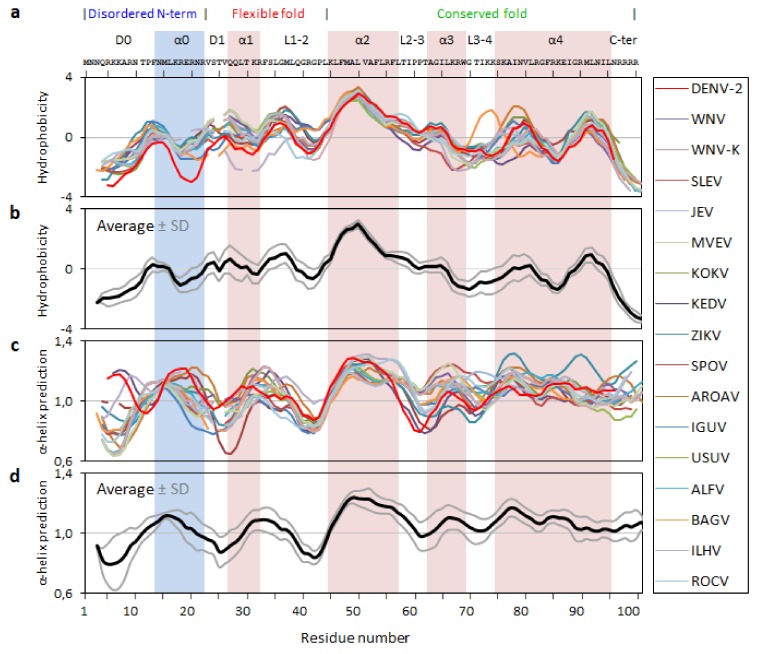
Figure 3.
Flavivirus C proteins hydrophobicity and secondary structure predictions. (a) Hydrophobicity predictions and (b) respective average (black line) ± standard deviation, SD (gray lines). (c) α-helical secondary structure predictions and (d) respective average (black line) ± SD (gray lines). Amino acid residues are numbered according to the consensus, coinciding with DENV 2 residues numbers.

