Figure 1.
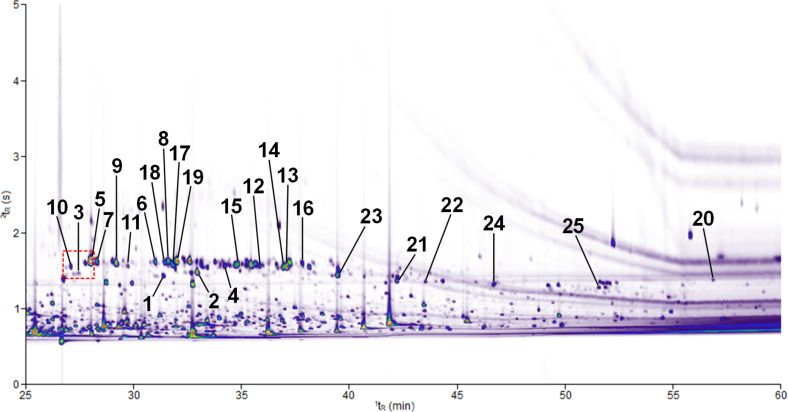
Contour plot of a HS-SPME–GC×GC–TOF–MS chromatogram (TIC) demonstrating the separation of volatile compounds isolated from the headspace of grape berries of the red wine variety Lemberger (Vitis vinifera subsp. vinifera, clone 1Gm, exocarp). 1tR (X-axis) corresponds to the retention time on the primary column and 2tR (Y-axis) to the retention time on the secondary column. The color gradient reflects the intensity of the TOF–MS signal on a white background from low (violet) to high (red). Numbers at peaks refer to compound numbers as defined in Figure 2 and Table 1. The area framed in red including the volatile compounds numbered 10, 3 and 5 is enlarged in Figure 3.

