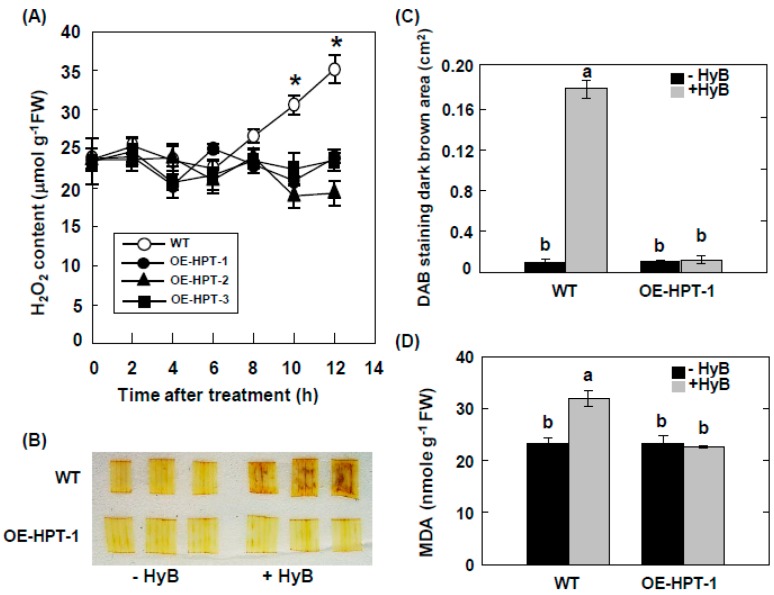
Figure 3.
H2O2 content in WT and HPT-overexpressing seedlings under HyB treatment. (A) changes in H2O2 content in leaf segments of WT and HPT-overexpressing 2-week-old seedlings treated with 50 mg L−1 HyB for 12 h. Data are mean ± SE (n = 4). * P < 0.05 compared with WT. (B) Histochemical detection of H2O2 with DAB staining in leaf segments of WT and HPT-Overexpressing rice plants (OE-HPT-1) treated with or without HyB. (C) Quantification of DAB staining. The histogram tool in ImageJ was used to record the grayscale values of all pixels within the brown areas of eight-bit images. (D) Malondialdehyde (MDA) content in WT and HPT-overexpressing rice plants (OE-HPT-1) treated with or without 50 mg L−1 HyB for 12 h. Data are mean ± SE (n = 4). Bars with a same letter are not significantly different at P < 0.05.

