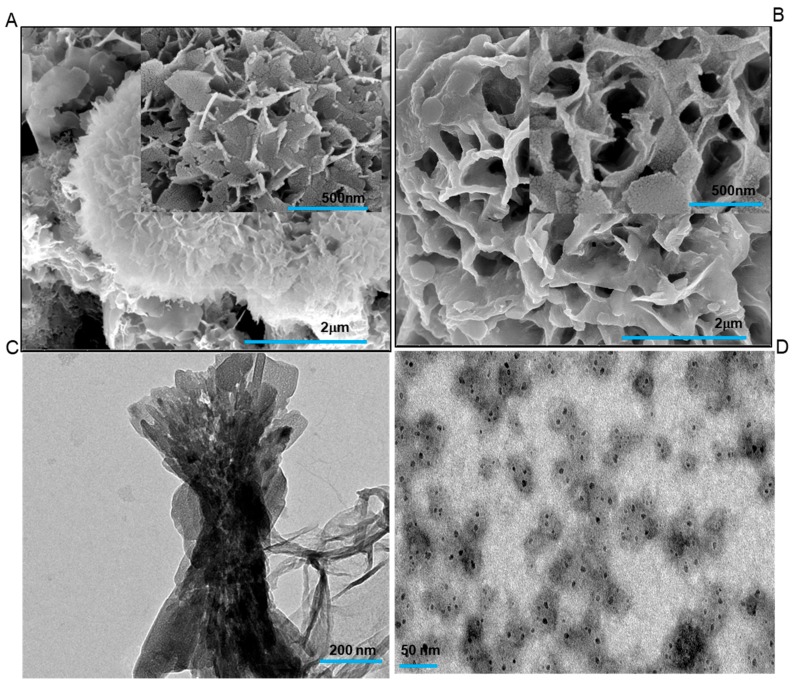
Figure 4.
(A) Control FESEM micrograph of calcium phosphate mineralization in the absence of any protein. The inset shows the calcium phosphate flakes at 500 nm, whereas the representative TEM image of calcium phosphate control is shown in (C). FESEM micrograph at (B) shows the absence of mineralization in the presence of Bovine serum albumin (BSA) protein and calcium phosphates. (D) shows the TEM image in the presence of BSA and calcium phosphates.

