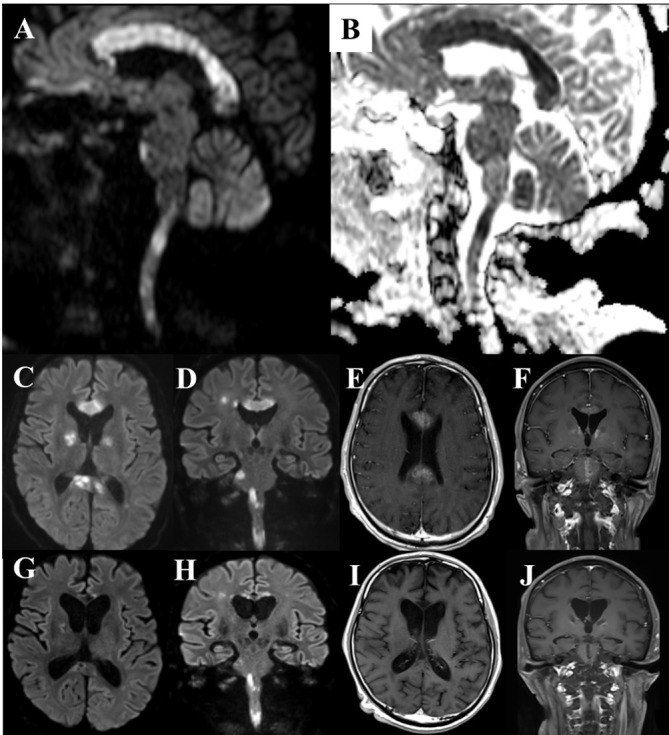
Figure 1.

(A–B) DWI MRI on POD 10 showed an increased signal in all the areas of the corpus callosum (CC), globus pallidus, forefront ventral part of the pons, and the upper cervical spinal cord. ADC map showed cytotoxic oedema in these lesions. (C–D) Axial and coronal DWI on POD 30. (E–F) Gadolinium-enhanced T1-weighted image (Gd-T1WI) on POD 30 showed diffuse enhancement in the CC, globus pallidus and ventral part of the pons. Imaging in the pons differed from that of the central pontine myelinolysis (no imaging). The lesions did not seem to respond to thiamin therapy on imaging. (G–H) DWI on POD 78. The CC became thin and the previously seen increased signal tended to disappear. (I–J) Gd-T1WI on POD 78. Enhancement in the CC and brainstem disappeared after three sets of steroid pulse therapy. ADC, apparent diffusion coefficient; Gd-T1WI, Gadolinium-enhanced T1-weighted image; POD, postoperative day; DWI, diffusion-weighted.
