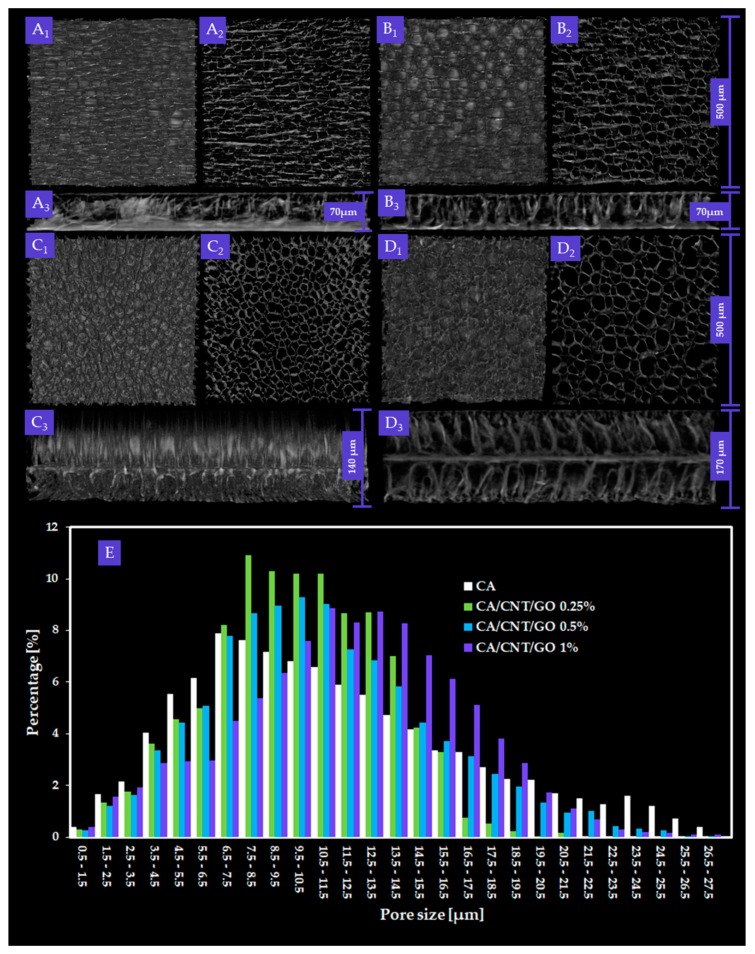
Figure 1.
Three-dimensional (3D) renderings of: cellulose acetate (CA) (A1) top view, (A2) transversal section, and (A3) cross-section; CA, carbon nanotubes, and graphene oxide (CA-CNT-GO) 0.25% (B1) top view, (B2) transversal section, and (B3) cross-section; CA-CNT-GO 0.5% (C1) top view, (C2) transversal section, and (C3) cross-section; and CA-CNT-GO 1% (D1) top view, (D2) transversal section, and (D3) cross-section; with measured pore size distribution (E). Overall, for images A1–2, B1–2, and C1–2, scale bar is 500 µm. Widths of membrane cross-section are scaled particularly.

