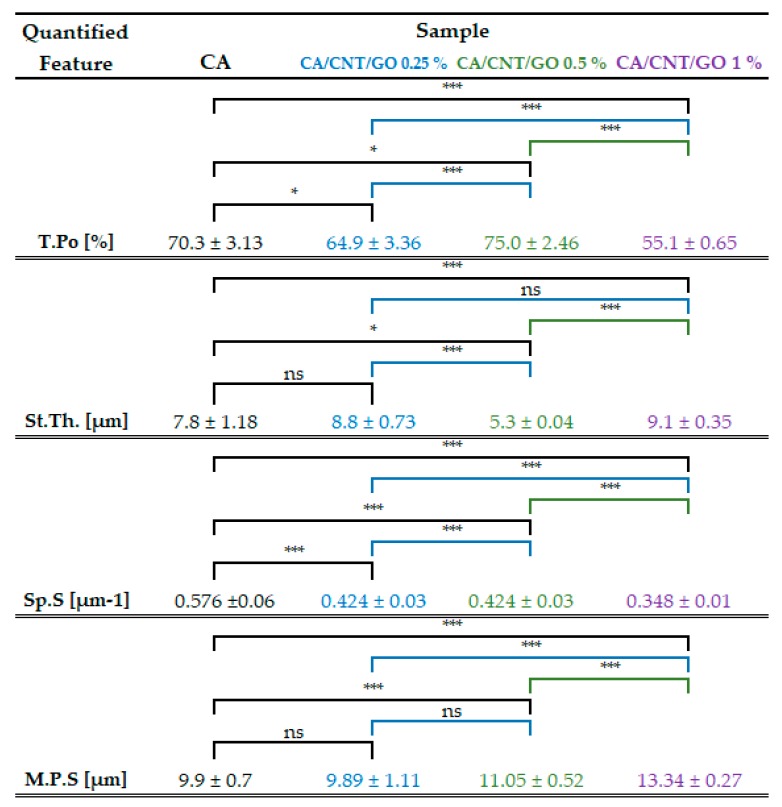
Figure 2.
Tabulation of the calculated values for total porosity (T.Po), structure thickness (St.Th), and specific surface (Sp.S) appraised as the ratio of object surface and object volume and mean pore size (M.P.S.). The values were averaged after 3D analysis carried out in CTAn for 4 distinct proportionate volumes of interest (VOIs) per composite sample. Standard deviation and statistical significances are illustrated related to the CA control and each CNT and GO addition. (* p < 0.05; *** p < 0.001; ns p > 0.05).

