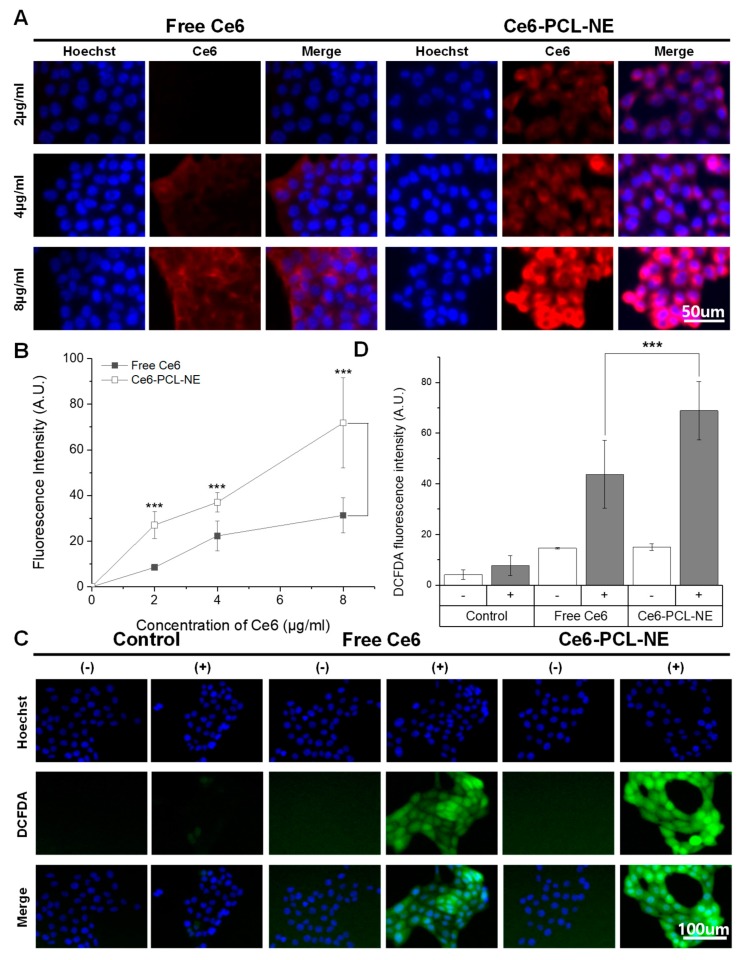
Figure 2.
Cellular uptake of Ce6-PCL-NE and ROS generation. (A) Fluorescence images of 4T1 tumor cells treated by free Ce6 or Ce6-PCL-NE for 2 h. (B) Fluorescence intensity with different concentrations of Ce6. Results represent mean ± s.d. (n = 10). *** p < 0.001. (C) Fluorescence signals of 2’,7’-dichlorofluorescein diacetate (DCFDA) in 4T1 tumor cells treated with free Ce6 or Ce6-PCL-NE for 2 h with or without laser irradiation. (D) Fluorescence intensity of DCFDA in (C). *** p < 0.001. Results represent mean ± s.d. (n = 10).

