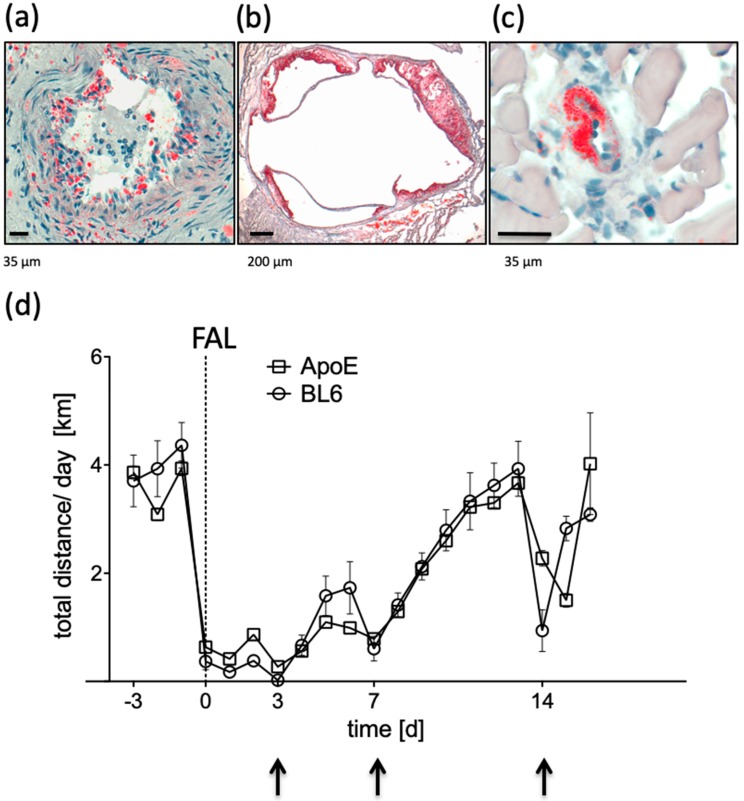
Figure 2.
Plaque development in (a) the femoral artery, (b) the aortic root, and (c) the collateral artery of ApoE−/− mice following 12 weeks of high fat diet, as visualized by Oil-red-O staining. (d) Daily running distances of C57BL/6 mice (BL6, circles) compared to ApoE−/− mice (ApoE, squares) over time, pre- and post-ligation of the femoral artery (FAL). Arrows indicate short term running breaks due to anesthesia during perfusion measurements.

