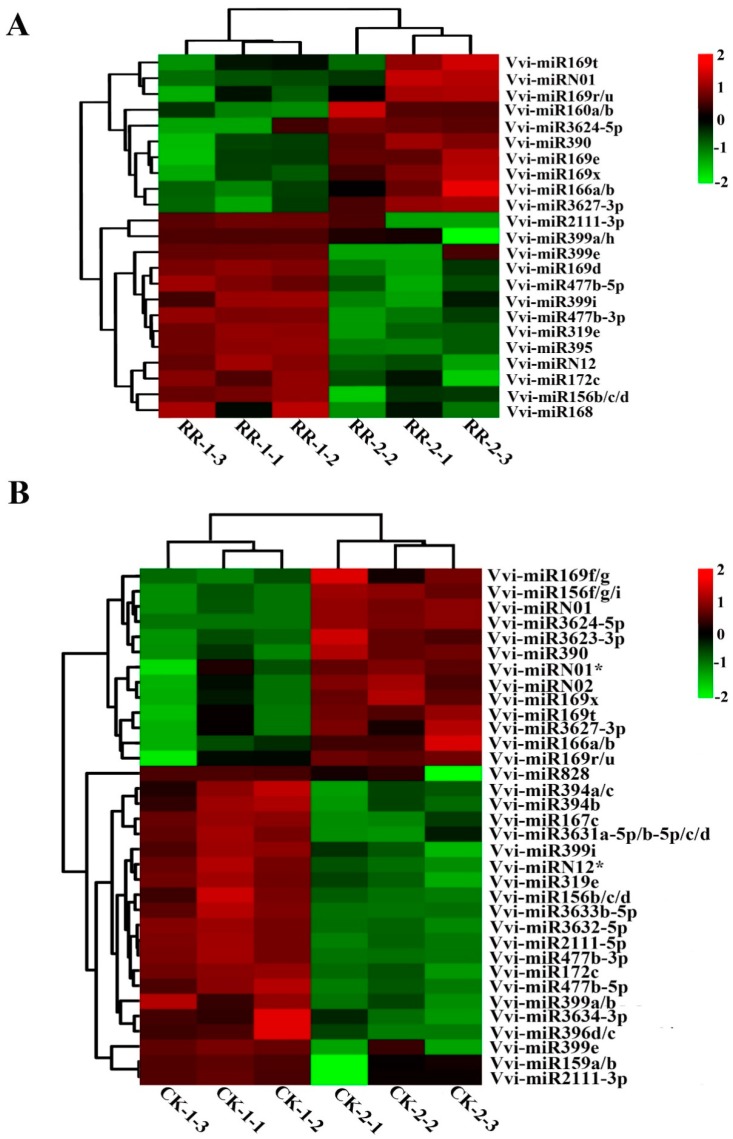
Figure 5.
Heat maps of the normalized expression level (TPM) of differentially expressed miRNAs at different periods of the same treatment. (A,B) were from samples collected from trees grown under root restriction and non-root restriction, respectively. RR-1: fruits collected on 14 July 2017 grown under root restriction; CK-1: fruits collected on 14 July 2017 grown under non-root restriction; RR-2: fruits collected on 9 August 2017 grown under root restriction; CK-2: fruits collected on 9 August 2017 grown under non-root restriction.

