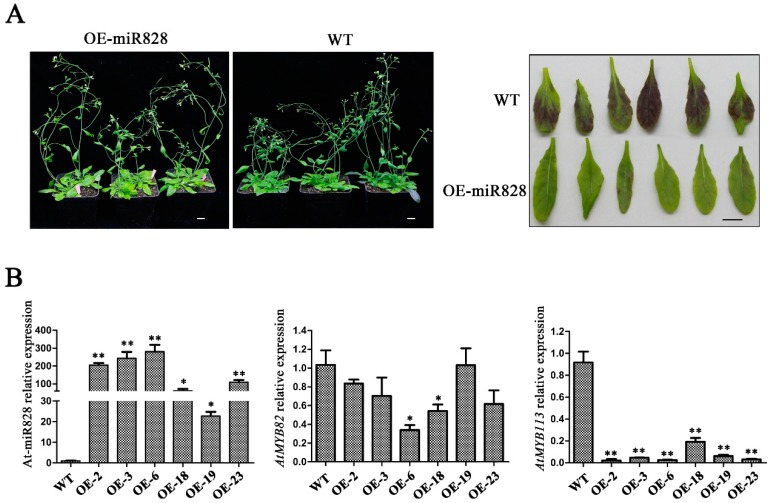
Figure 10.
Phenotypic characterization of wild type and transgenic Arabidopsis. (A) Image of wild type (WT) and transgenic Arabidopsis and images of the back of rosette leaves of wild type (WT) and transgenic plants. Scale bar: 1 cm. (B) Expression levels of ath-miR828 detected by step-loop qRT-PCR and its target genes. * p < 0.05 and ** p < 0.01 respectively, according to two-tailed Student’s t-test. Error bars show the standard error between three biological replicates (n = 3).

